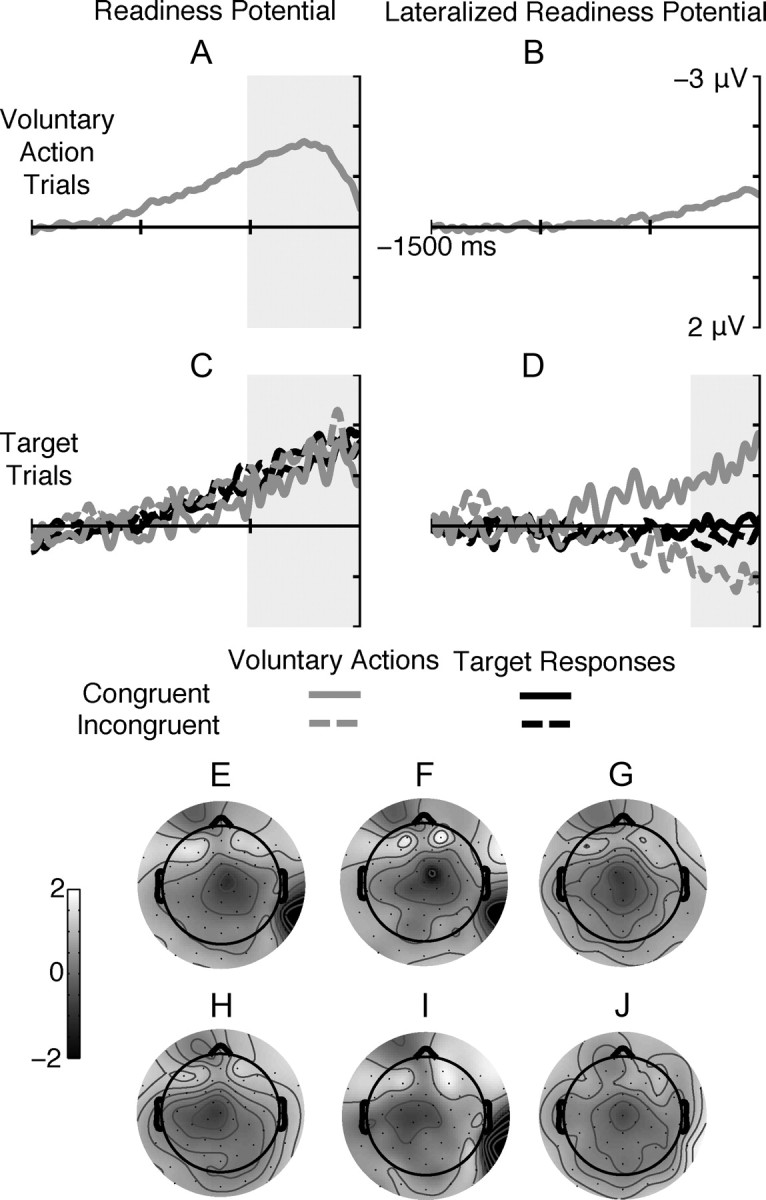
Figure 3.

Motor activation before action onset for voluntary action trials (A, B) and stimulus onset for target trials (C, D). A, B, RP (A) and LRP (B) onset before action onset for voluntary action trials. C, D, RP (C) and LRP (D) before S2 onset (0 ms) for target trials: Gray lines signify trials where the voluntary action was performed (as identified by individual participant RT distribution), and black lines indicate trials where participants genuinely responded to the target stimulus. Solid lines indicate trials where the S2 stimulus was congruent with the intended voluntary action, and dashed lines indicate incongruent trials. LRP plotted relative to the correct response to the target stimulus, such that negative values correspond to activation of the hand required by the target stimulus. E–J, Topographic plots show ERP amplitude averaged over the 500 ms period before action/stimulus onset for left-hand (E–G) and right-hand actions (H–J), for voluntary actions on voluntary action trials (E, H) and on target trials (F, I) as well as for target responses (G, J).
