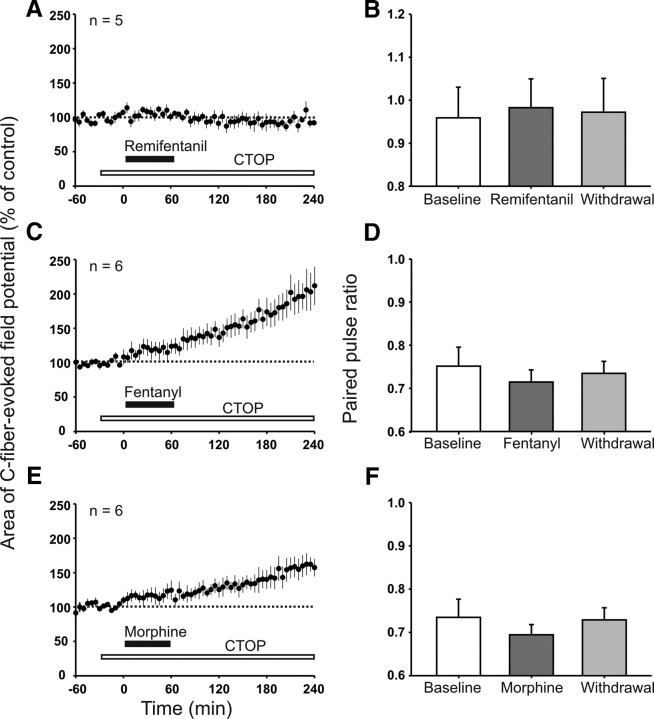
Figure 4.
Blockade of spinal MORs prevented LTP induction after withdrawal from intravenous remifentanil and unmasked an immediate-onset facilitation by intravenous fentanyl and morphine. In graphs A, C, and E, areas of C-fiber-evoked field potentials were normalized to predrug values (dotted line) and plotted against time (minutes). A, Spinal superfusion with the MOR antagonist CTOP (white bar; 10 μm) abolished the depression during intravenous remifentanil (black bar; dosing as in Fig. 1A) and the subsequent withdrawal LTP. C, E, Intravenous infusion of fentanyl (black bar; intravenous dosing as in Fig. 1B) or morphine (black bar; dosing as in Fig. 1C) under spinal blockade of MORs by topically applied CTOP (white bar; 10 μm) induced an immediate-onset, descending facilitation that persisted until the end of the recording period. B, D, F, Bar graphs represent the corresponding mean PPR during baseline (30 min before opioid infusion), during opioid infusion (at 15–45 min after onset of the infusion), and after withdrawal (at 15–45 min after termination of the infusion). PPR remained unchanged during and after intravenous remifentanil, fentanyl, and morphine infusion when spinal MORs were blocked with CTOP.

