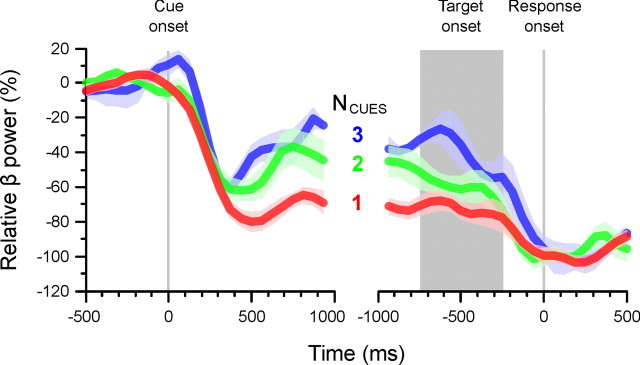
Figure 5.
Time course of relative beta-band power for each number of cue condition. The power was centered relative to the baseline and normalized relative to the average power during all motor responses. The plots show the average time-series across subjects, and its SE, aligned to the onset of the cue period (left) and to the onset of the motor response (right). The gray rectangle indicates the range of target onset times.

