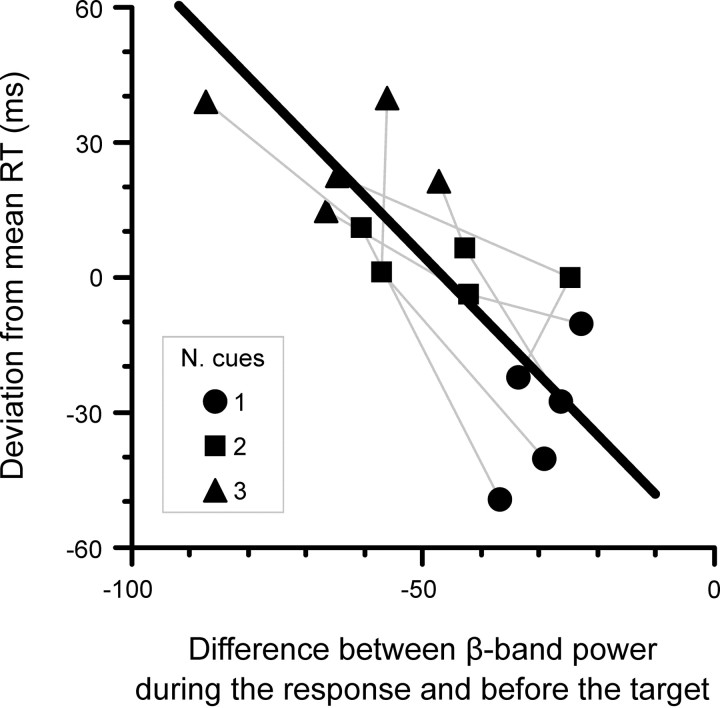
Figure 6.
Relation between RT and beta-band power. The scattergram shows the deviation of RT from the mean against the difference between beta-band power during the response and beta-band power preceding target onset for each number of cue condition and subject. The data from a same subject are connected by a gray line. The black line across the data points represents the least-squares fit considering subject as a random factor.

