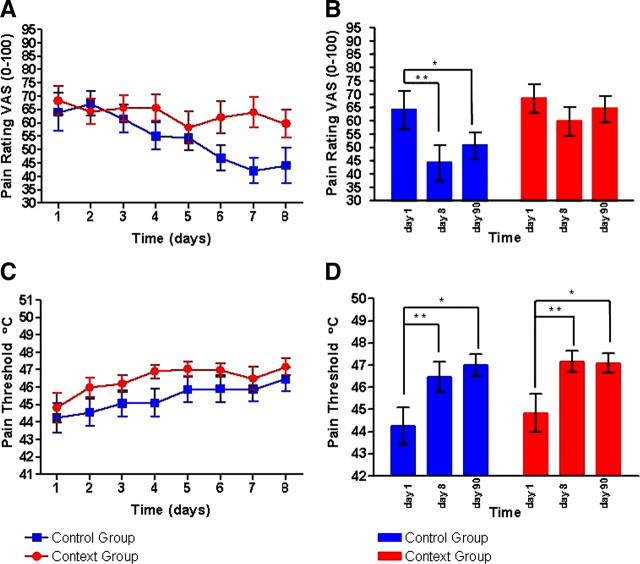
Figure 1.
Pain ratings and pain thresholds for the context group (red) and the control group (blue). The upper row (A, B) displays the pain ratings on a visual analog scale from 0 (no pain) to 100 (worst pain imaginable) for the 8 d of the experiment (A) and for the scanning days (B). A significant day × context interaction was found between the context and the control group. The lower row (C, D) displays the pain thresholds for heat pain (when heat becomes painful) in degrees Celsius for the 8 d of the experiment (C) and for the scanning days (D).

