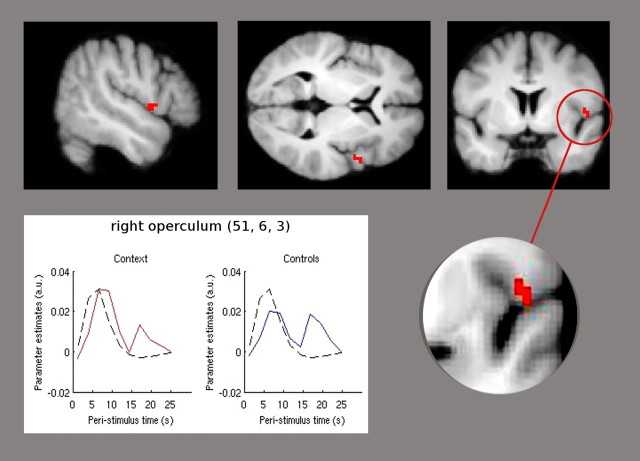
Figure 2.
The context group showed significant higher activation (p < 0.001 uncorrected) of the right parietal operculum compared to the control group. Statistical parametric maps demonstrating this difference are superimposed in red on a structural T1-weighted MRI used for spatial normalization (upper row). Lower row, The plot is derived from an FIR basis set. Parameter estimates, diagramed on the y-axis, illustrate the averaged time course of the poststimulus BOLD signal in the peak voxel derived from the right parietal operculum at [51, 6, 3]. The red line represents the FIR of the context group, the blue line shows the FIR of the control group, and the black line presents the HRF. The x-axis indicates the poststimulus time in seconds from 0 to 26 s, and the y-axis shows the parameter estimates that are directly proportional to the BOLD signal. The hemodynamic response of the right operculum shows an identical onset and duration of the finite impulse response for both groups, whereas the extent of activation following pain stimulation is higher in the context group.

