Figure 2.

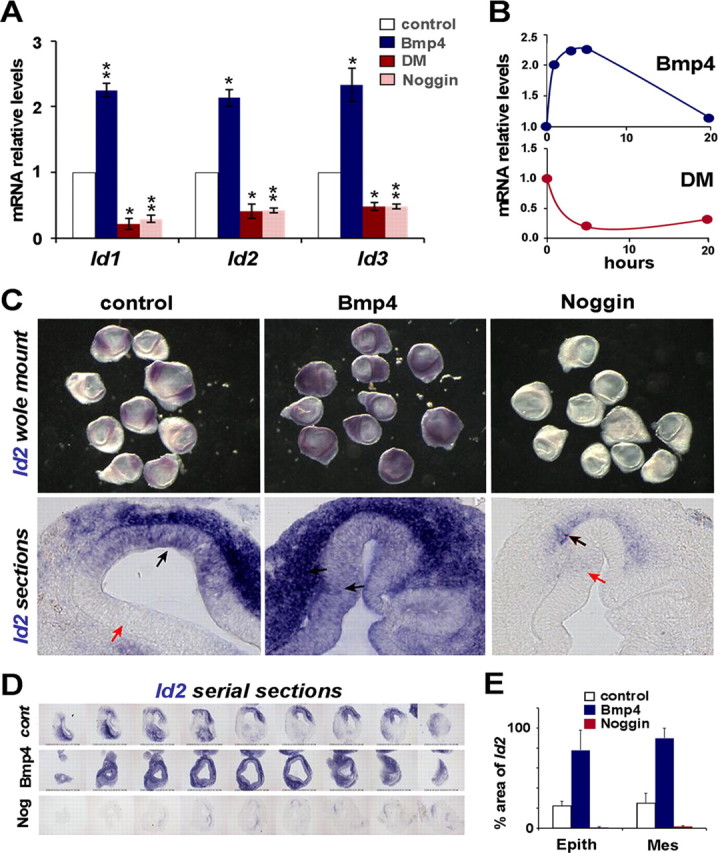
Effects of Bmp signaling on Id expression. A, Quantitative RT-PCR analysis of the effects on Id1-3 mRNA levels after 5 h-incubation with Bmp4 (20 ng/ml, blue), Dorsomorphin (10 μm, red), or Noggin (1 μm, light red). mRNA levels in treated vesicles (blue, red and light red bars) are referred to control values (white bars), which were arbitrarily set to 1 and normalized for GAPDH expression. Error bars represent SEM. One asterisk indicates p < 0.05 and double asterisks p < 0.01 levels of significance of the difference with respect to control values calculated by the Student's t test. All three Id genes were induced with Bmp4 treatment and downregulated by Bmp blockade with either Noggin or Dorsomorphin. B, Time course of Id1 expression after treatment with Bmp4 (20 ng/ml, top graph), or Dorsomorphin (10 μm, bottom graph). C, Effect of Bmp4 on Id2 expression in situ. Otic vesicles were isolated at HH21 and cultured for 4 h either in control media, or with the addition of 100 ng/ml Bmp4, or 1 μg/ml Noggin. The top row shows whole-mount otic vesicles and the bottom row cryostat sections of the cultured otic vesicles. Black arrows indicate sites of strong Id2 expression and red arrows indicate sites where Id2 was not detected. D, Serial sections covering an entire otic vesicle, showing one example for each condition. E, Quantitative analysis of the effects of Bmp4 and Noggin on Id2 expression as evaluated by ISH. Values of the columns represent the percentage of surface area positive for Id2-positive signal in both epithelium and mesenchyme (see Materials and Methods).
