Figure 3.
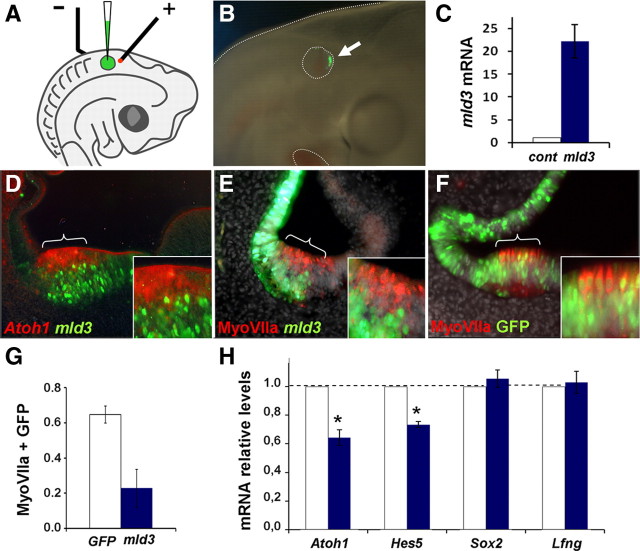
mId3 interferes with Atoh1 expression and hair cell formation. A, Focal electroporation of mId3 in HH20-21 otic vesicles: diagram of the arrangement for electroporation of HH20-HH21 otic vesicles with a method modified from Chang et al. (2008). B, Example of GFP expression detected 24 h after electroporation. C, qRT-PCR analysis of mId3 transgene mRNA levels. D, The prospective anterior crista was electroporated with pCIG-mId3-IRES-GFP (8 μg/ml) vector, and probed for Atoh1 by in situ hybridization (red) and immunostained for GFP (green) after 24 h. E, An experiment similar to that in D, but immunostained for MyoVIIa (red) 48 h after transfection. F, Control experiment in which the prospective anterior crista was electroporated with pCIG-GFP (9 μg/ml) vector and analyzed with MyoVIIa immunolabeling (red). Note that cells electroporated with mId3 (green in D and E) did not express Atoh1 or MyoVIIa and were located at the basal aspect of the sensory patch, whereas in the control experiment MyoVIIa-positive hair cells (luminal) and supporting cells (basal) did express GFP indistinctively. G, The bar diagram represents the fraction of cells from equivalent electroporated domains that coexpressed GFP and MyoVIIa after electroporation with the pCIG-GFP control vector (white bar, n = 4) or with pCIG-mId3-IRES-GFP (blue bar, n = 4). Double-labeled cells were much fewer after mId3 electroporation than after control GFP electroporation (p < 0.05). H, mId3 reduced Atoh1 mRNA levels. Otic vesicles were electroporated with mId3-IRES-GFP vector as above, and analyzed by qRT-PCR after 24 h of development in ovo, for Atoh1, Hes5, Sox2 and Lfng expression. Forced expression of mId3 significantly reduced Atoh1 and Hes5 mRNA levels, with no significant effect on Sox2 or Lfng. mRNA levels in electroporated vesicles (blue bars) are referred to control values (white bars), which were arbitrarily set to 1 and normalized for GAPDH expression. Error bars represent SEM. One asterisk indicates p < 0.05 level of significance of the difference with respect to control values calculated by the Student's t test.

