Figure 6.
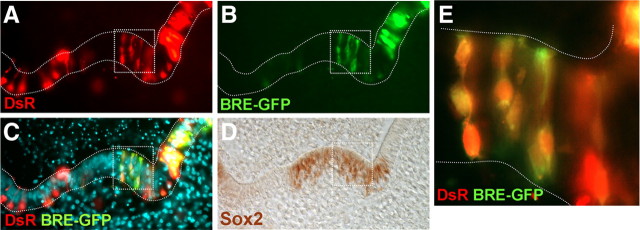
Smad transcriptional activity in differentiating sensory organs. Smad transcriptional activity was monitored with BRE-tk-EGFP reporter. A–D, Cryostat section of the lateral crista showing direct DsRed signal (A) and EGFP signal driven by BRE (B). The merged image is shown in C. The same section was immunostained for Sox2 (D) to identify the location of the sensory patches. The boxed area in A–D was magnified in E, showing the overlapped signal of DsRed and BRE-EGFP within the Sox2-positive domain.

