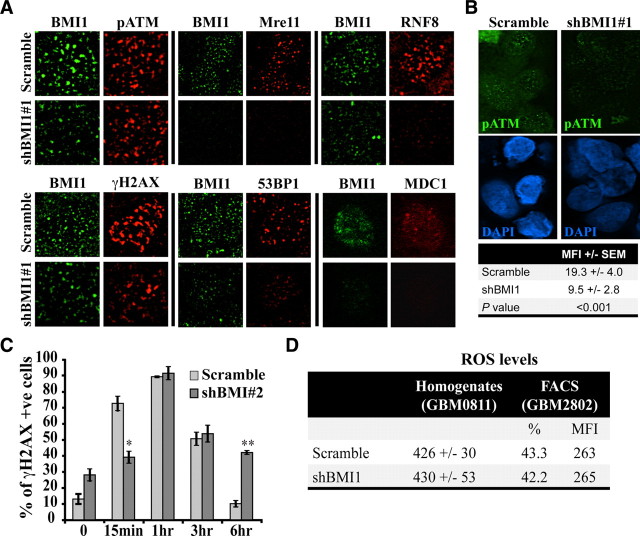
Figure 5.
BMI1 deficiency impairs the DNA damage response. A, BMI1 depletion impairs recruitment of DNA damage response machinery. GBM cells were infected with scramble or shBMI1#1 viruses and irradiated at 3 Gy. One hour after IR, cells were fixed and colabeled with BMI1 and p-ATM, Mre11, RNF8, γH2AX, 53BP1, or MDC1 antibodies. Panel represents a deconvolution images acquired with a Leica DMRE fluorescence microscope and the OpenLab 3.1.1 software, with the exception of the MDC1 data, which was acquired with a Zeiss confocal microscope and the LSM software. The cell lines used were GBM0811, GBM2002, GBM2802, and GBM0611. B, BMI1 depletion impairs the recruitment of pATM. GBM cells were processed as in A, and pATM signal intensity was quantified using ImageJ software. Data are expressed as mean fluorescence intensity (MFI) ± SD. For each samples, 50 cells were analyzed. The cell line used was GBM2802. C, BMI1 depletion affects the kinetic of DNA repair. GBM cells infected with the scramble or shBMI1#2 virus were fixed at different time points after IR and labeled with the γH2AX antibody. The total number of γH2AX-positive cells was scored and presented as the percentage of γH2AX-positive cells over total DAPI-stained nuclei. Data are mean ± SEM (n = 3, *p < 0.05, **p < 0.01). The cell lines used were GBM0811 and GBM2802. D, GBM cells were infected with the scramble or shBMI1#1 virus, and ROS levels were determined (1) by using the DCF-DA tracer on cell homogenate (excitation and emission wavelength were 485 and 530 nm, respectively) or (2) on whole cells by FACS analysis, which gives the percentage of positive cells, and the respective MFI. Note that BMI1 knockdown had no effect on ROS levels.

