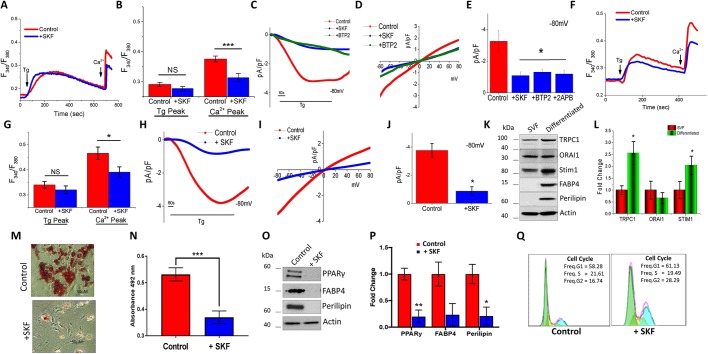
Fig. 1.
SOCE is essential for the differentiation of subcutaneous adipocytes. (A,B,F,G) Fura-2 fluorescence traces (F340/F380, 340 nm:380 nm fluorescence ratio) of transient increase in [Ca2+]i after addition of 1 μM Tg and 1 mM Ca2+ to Subc-AT SVF (A) and differentiated Subc-AT (F) in control and cells pre-treated with 10 μM SKF for 15 min. Graphs quantify Tg-induced ER Ca2+ release and Ca2+ entry peaks for Subc-AT SVF cells (B) and differentiated Subc-AT (G). Each bar gives the mean±s.e.m. of 60–90 cells in three separate experiments. (C–E,H–J) Application of 1 μM Tg induced inward currents at −80 mV in control, SKF-, 2APB- or BTP-treated Subc-AT SVF cells (C) and differentiated Subc-AT (H). Respective I–V curves are shown for Subc-AT SVF (D) and differentiated Subc-AT (I). Quantification (n=7–9 recordings) of current intensity at −80 mV is shown for Subc-AT SVF (E) and differentiated Subc-AT (J). (K,L) Western blot (K) with quantification (L) of TRPC1, ORAI1, Stim1, FAPB4 and perilipin protein expression normalized to actin and presented as fold change relative to control untreated cells in Subc-AT SVF and differentiated Subc-AT (n=3). (M) Oil-Red-O staining (using 10× objective) of Subc-AT differentiated in the presence of SKF (10 µM) for 7 days. (N) Quantification of absorbance at 492 nm of stained lipid droplets using eluted Oil-Red-O stain (n=3). (O,P) Western blot (O) and protein level quantification (P, normalized to actin and presented as fold change relative to control untreated cells) of PPARγ, FAPB4 and perilipin protein expression in differentiated Subc-AT, in control cells and in the presence of SKF (n=3–4). (Q) Cell cycle analysis on control and SKF-treated Subc-AT cells (10 µM). Graphs are mean±s.e.m. *P<0.05, ***P<0.001 using one-way ANOVA.

