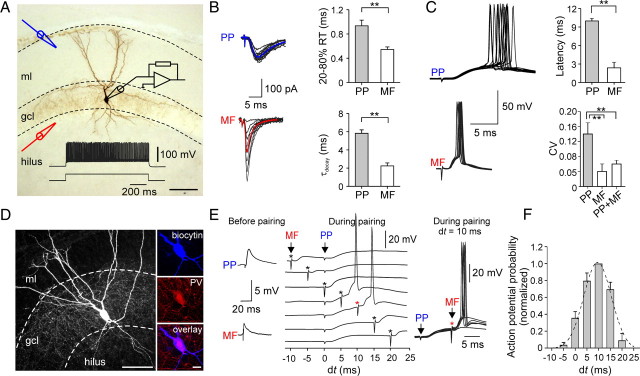
Figure 1.
Convergence of slow perforant path- and fast mossy fiber-mediated excitation leads to reliable and precise activation of DG perisomatic inhibitory interneurons. A, Illustration of the EPSC recording configuration. Black electrode, Somatic whole-cell recording from a PII; blue electrode, placed in the outer ml for extracellular stimulation of PP fibers; red electrode, positioned at the gcl–hilus border to stimulate MFs. Cell was filled with biocytin during the recording and visualized with DAB as chromogen. Dense axonal arbor in the gcl identify this cell as PII. Inset, Fast-spiking phenotype of the same PII (600 pA). The dashed lines indicate the borders of the gcl and the ml. B, Superimposed individual EPSCs (black) in response to PP (top) or MF (bottom) stimulation, recorded in the same PII. Note fluctuation in the peak amplitude of MF-mediated EPSCs. Stimulation intensity was set to 1.5 times the minimal stimulation. The blue and red traces are averaged EPSCs. Right, Bar charts provide comparison of 20–80% RT and decay time constant (τdecay) of average EPSCs. C, Left, Superimposed action potentials during PP (top) or MF (bottom) stimulation recorded in current-clamp mode. Right, Comparison of mean values and the CV of evoked action potential latencies. D, Left, Projection of a confocal image stack of another recorded PII. The biocytin-filled interneuron was visualized using streptavidin-conjugated Alexa 647 dye. Right, High-power confocal images show immunoreactivity for parvalbumin (PV) in the soma of the same cell. E, Pairing of PP- and MF-EPSPs with varying relative latencies (dt = tMF − tPP). PP stimulation was applied at t = 0 ms and timing of the MF stimulation (asterisk) was changed in 5 ms steps between −10 and +20 ms. The left panel shows the subthreshold PP- and MF-EPSPs. On the right, superposed responses illustrate the efficient initiation of action potentials by the paired stimuli with a 10 ms relative delay. F, Bar chart summary of action potential probability as a function of the delay dt between PP and MF stimulation (5 cells). Data were normalized to values obtained at dt = 10 ms and fitted with a Gaussian function (dashed line). Scale bars: A, D, left, 100 μm; D, right, 20 μm. **p < 0.01, two-tailed Student's t test. The bars represent means ± SEM.

