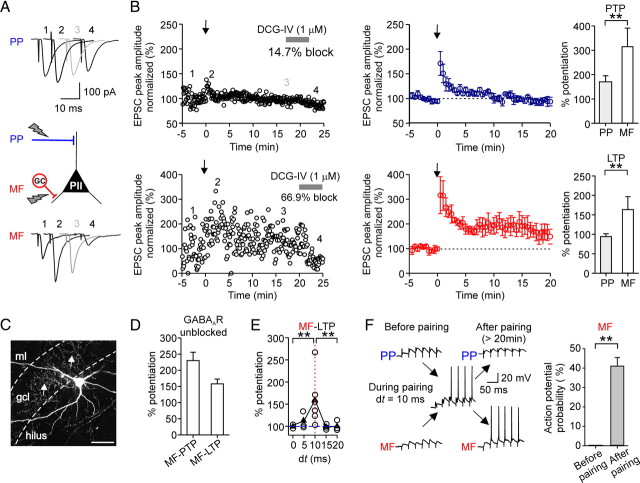
Figure 2.
Associative pairing of perforant path and mossy fiber inputs in perisomatic inhibitory interneurons induces Hebbian LTP selectively at mossy fiber synapses. A, To test plasticity, an aBFS pattern was applied, in which PP stimulation preceded MF stimulation by 10 ms (spike probability during pairing in this experiment 71%, corresponding to a mean discharge frequency of 24 Hz). The panel shows average EPSCs in response to PP (top traces) or MF (bottom traces) stimulation before the aBFS (1), immediately after the aBFS, during PTP (2), 15–20 min after the aBFS induction (gray) (3), and after application of 1 μm DCG-IV (4). B, Left, Normalized EPSC peak amplitudes are plotted against time from a single experiment. PP- (top plot) and MF-mediated EPSCs (bottom plot) were recorded in an alternating manner in the PII (800 ms apart). EPSCs were normalized to the baseline. The arrows indicate the time of the pairing protocol. Middle, Summary plots of the experiments from five cells. Each circle represents the average of EPSCs over 30 s intervals for five cells; PP-EPSC amplitudes are in blue, and MF-EPSCs are in red. Right, Bar graphs compare the extent of PTP and LTP at the two pathways. C, Morphology of the PII from which data are shown in A and B. The arrows point to axon collaterals in the gcl. The dashed lines indicate borders of the gcl toward the ml and the hilus. D, Summary bar graph illustrates the level of PTP and LTP at MF–PII synapses induced by associative pairing in the presence of GABAergic transmission (3 cells). E, Summary plot shows the potentiation of the EPSC peak amplitude, measured 15–20 min after aBFS application, as a function of the relative latency between the PP and MF stimulation (dt). The open circles represent data from individual experiments, and the filled triangles represent the mean values for every dt. F, MF-EPSPs but not PP-EPSPs can recruit PIIs after LTP induction. Brief trains (30 Hz) of EPSPs evoked by PP (top traces) or MF (bottom traces) stimulation before pairing (left) and >20 min after LTP induction (right). Responses to the first 6 of 25 consecutive pulses are shown. Right, Summary bar graph of the probability of action potential generation in response to burst stimulation of MF synapses before and after the pairing from five cells. Scale bar, 100 μm. **p < 0.01, two-tailed Student's t test and Mann–Whitney U test. Average measurements are given as mean ± SEM.

