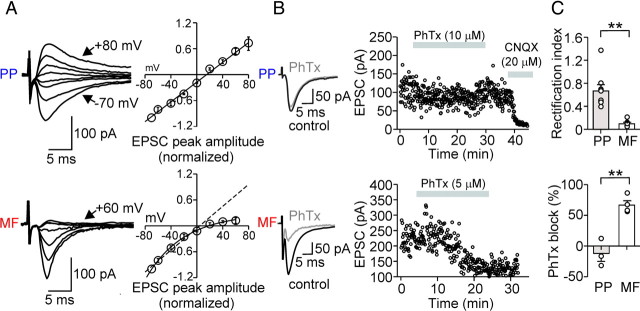
Figure 4.
Afferent-specific expression of Ca2+-impermeable and Ca2+-permeable AMPA receptors in perisomatic inhibitory interneurons. A, Left, Average EPSCs from 30 single traces evoked at PP–PII (top) and MF–PII (bottom) inputs for various holding potentials (10 or 20 mV increments). Right, Current–voltage (I–V) relationship for PP- (top; 9 cells) and MF-mediated (bottom; 6 cells) EPSCs in PIIs. Peak amplitudes of the average EPSCs were plotted against the holding potential. The black curves represent the linear (top) or polynomial function (bottom) fitted to the data. The inwardly rectifying I–V relationship at MF–PII synapses is a hallmark of CP-AMPARs (Geiger et al., 1995; Tóth and McBain, 1998). B, MF-mediated EPSCs are blocked by 5–10 μm PhTx-433, a selective CP-AMPAR blocker (Tóth and McBain, 1998). Left, Superposed average EPSCs evoked at PP–PII (top) and MF–PII (bottom) synapses under control conditions (black traces) and during bath application of PhTx-433 (gray traces). Right, Time course of the PhTx-433 effect; peak amplitude of EPSCs evoked at the PP (top) and the MF inputs (bottom) are plotted against time. The gray bars represent the wash-in of PhTx-433 and, at a later phase, CNQX. C, Top bar graph, Summary of the rectification index (EPSC at +60 mV/EPSC at −60 mV) for EPSCs evoked at PP–PII (9 cells) and MF–PII synapses (6 cells). Bottom bar graph, Comparison of the average block of PhTx-433 on PP- (3 cells) and MF-mediated EPSCs (4 cells). **p < 0.005; Mann–Whitney U test. Average measurements represent mean ± SEM.

