Figure 5.
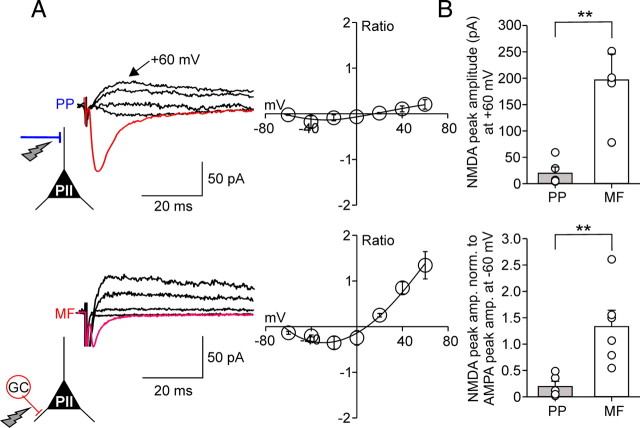
The ratio between NMDA receptor- and AMPA receptor-mediated components is larger at mossy fiber than at perforant path input synapses onto perisomatic inhibitory interneurons. A, Left in red, AMPAR-mediated average EPSCs (30 single traces) at a Vhold of −60 mV at PP–PII (top) and MF–PII (bottom) synapses (in the absence of NMDAR blocker). Superimposed in black, Average NMDAR-mediated EPSCs evoked at four selected holding potentials (−20, +20, +40, and +60 mV) after bath application of the AMPAR blocker CNQX (20 μm). Right, I–V relationship for the PP–PII (top; 5 cells) and the MF–PII synapse-mediated (bottom; 6 cells) NMDA component normalized to the AMPAR-mediated component at −60 mV. The black curves represent third-order polynomial functions fitted to the data. B, The top bar graph summarizes the peak amplitude data for NMDAR-mediated EPSCs recorded at +60 mV evoked at PP–PII and MF–PII synapses. The bottom bar graph compares the NMDAR-mediated component at +60 mV normalized to EPSCs evoked by AMPAR activation at −60 mV for the two pathways. **p < 0.01, two-tailed Student's t test. Average measurements represent mean ± SEM.

