Figure 2.
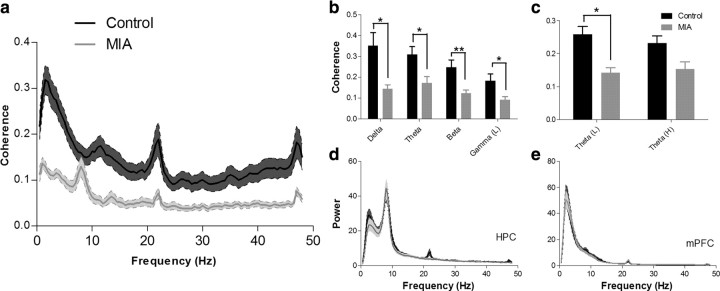
a, Coherence spectrogram (mean ± SEM) of EEG simultaneously recorded from HPC and mPFC in control and MIA animals. There were significant reductions in coherence in the MIA animals in the delta, theta, beta, and low-gamma frequency bands as shown in b (mean ± SEM). A subsequent analysis (c) revealed that differences in coherence within the theta band primarily occur in the 4–7 Hz low-theta range. d, e, Mean ± SEM power spectral density plots of EEG from control and MIA animals recorded from the HPC and mPFC. MIA and control EEG recordings were found to have similar power across all frequency bands in both the HPC and mPFC recordings. *p < 0.05; **p < 0.01.

