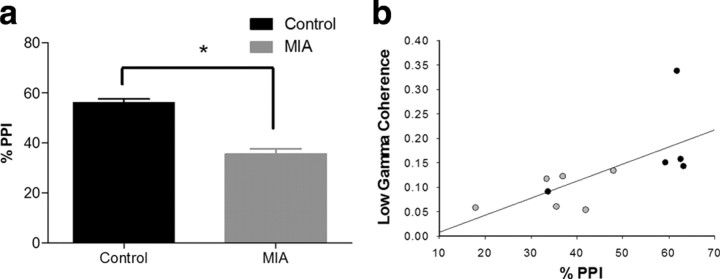
Figure 3.
a, Graph showing the sensory gating (%PPI) in control and MIA animals (mean ± SEM). There was a significant reduction (*p < 0.05) in the MIA group. b, Scatter plot showing distribution of percentage PPI and low-gamma coherence (30–48 Hz) scores for MIA (gray) and control (black) animals (Spearman's rank order correlation coefficient, r = 0.827, p < 0.001). This effect was not driven solely by the highest coherence animal (top right data point) as with this data point removed (r = 0.818, p = 0.002).

