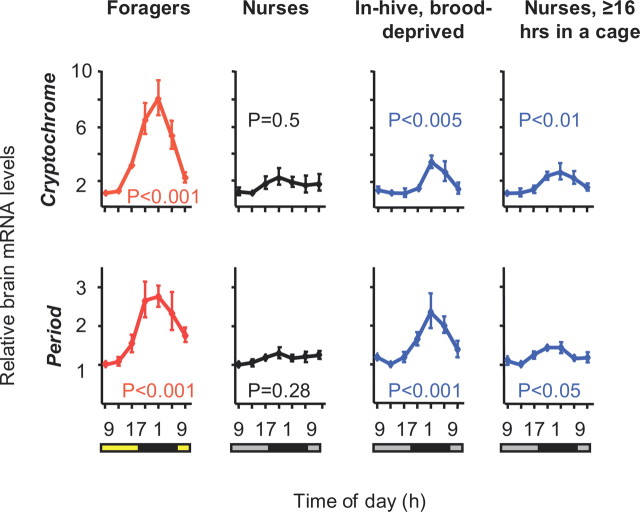
Figure 2.
The social context influences the temporal pattern of clock gene expression in young bees. The plots show brain Per and Cry mRNA levels (mean ± SE) for full sister bees from colony S77. “Foragers,” worker bees returning to the hive with pollen loads; “Nurses,” 7-d-old bees that were seen tending brood; “In hive, brood-deprived,” nurse-age bees that were caged on a broodless comb inside the hive; “Nurses, ≥16 h in a cage,” nurse bees that were transferred to a cage outside the hive for ≥16 h and sampled at the age of 7 d. Sample size = 5–6 bees/time point. The bar at the bottom of each plot depicts the illumination regime on the day of sample collection. Black bar, night or subjective night; gray bar, subjective day; yellow bar, day (light on). The p-values were obtained from one-way ANOVAs for the ΔΔCt values. Similar results were obtained in two additional trials with bees from different source colonies (S26 and H7; supplemental Fig. S2, available at www.jneurosci.org as supplemental material).

