
Figure 6.
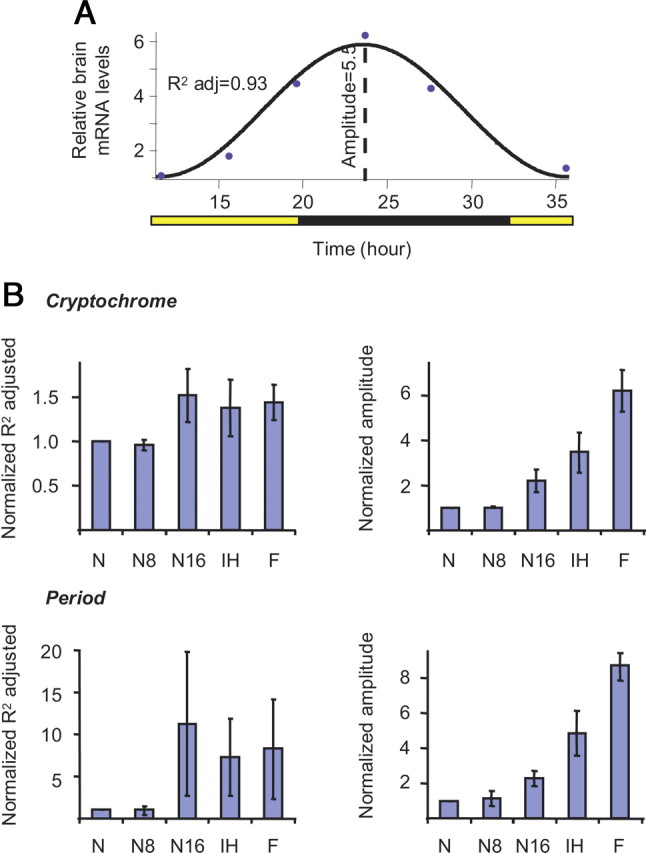
The social environment influences the temporal pattern of clock gene expression. A, Indices for the degree of oscillation in clock gene expression. The black line depicts the best fit cosine? model; the circles are the average measured brain clock gene mRNA levels for each time point. The regression coefficient (adjusted R 2) and amplitude were used for constructing the plots in B. B, Average regression coefficient (left column) and amplitude (right column) for Cry and Per mRNA expression (mean ± SE). N, nurses; N8, nurses assayed after ≥8 h outside the hive; N16, nurses assayed after ≥16 h outside the hive; IH, nurse-age workers that developed on a broodless cage inside the hive; F, foragers. The values were normalized relative to the value of nurses from the same colony (see the relative transcript levels for these bees in Figs. 2 and 5).