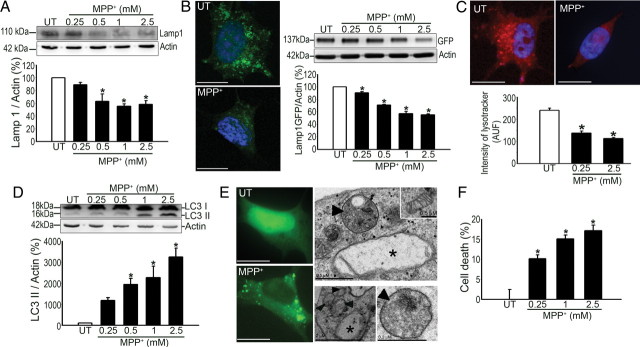
Figure 2.
Lysosomal depletion and AP accumulation in MPP+-treated cells. A, Lamp1 immunoblot levels in human dopaminergic BE-M17 neuroblastoma cells intoxicated with different doses of MPP+ for 24 h. B, Left, Lamp1-GFP fluorescent signal (green; nucleus in blue) in untreated (UT) and MPP+-intoxicated transfected cells. B, Right, GFP immunoblot levels in UT and MPP+-intoxicated Lamp1-GFP-transfected cells. C, Top, LysoTracker fluorescent pattern (red; nucleus in blue) in UT and MPP+-intoxicated cells. C, Bottom, Intensity of LysoTracker fluorescent signal in UT and MPP+-intoxicated cells, quantified by flow cytometry. D, LC3II immunoblot levels in UT and MPP+-intoxicated cells. E, Left, GFP-LC3 fluorescent signal (green) in UT and MPP+-intoxicated transfected cells. E, Right, Electron microscopy images from MPP+-intoxicated cells (arrowheads, AP; asterisks, abnormal mitochondria; inset, normal mitochondria). F, Cell death in UT and MPP+-intoxicated cells, as assessed by MTT assay. In all panels, n = 3–5 per experimental group. MPP+, 0.25 mm (unless otherwise indicated). *p < 0.05 compared with UT cells. Scale bars, 10 μm (unless otherwise indicated).

