
Figure 4.
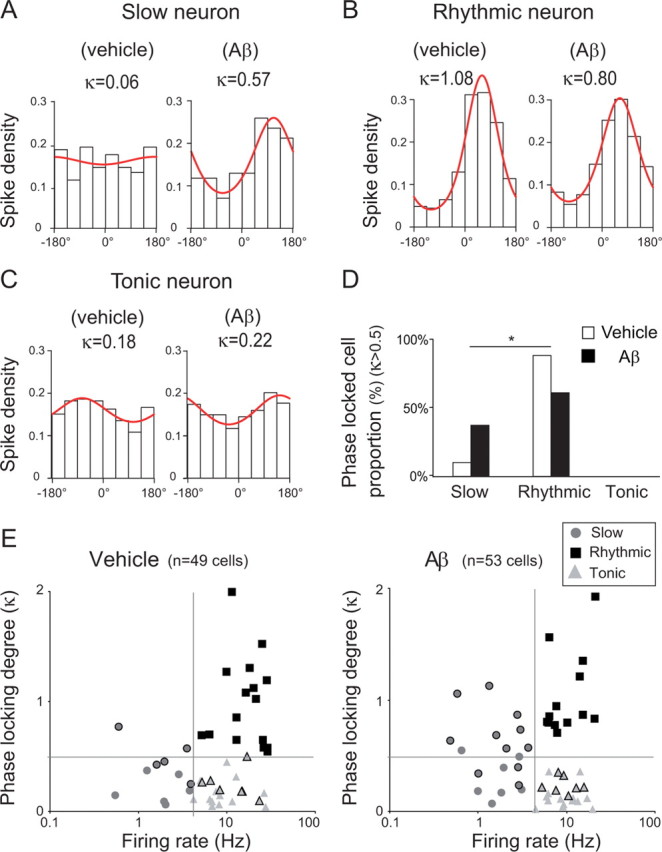
Increased occurrence of θ phase-locked slow neurons after hippocampal Aβ injection. A–C, Examples of spike distribution within the θ cycle for slow (A), rhythmic (B), and tonic (C) neurons. The phase distribution of spikes was fitted with a von Mises distribution and its concentration parameter (κ) provides a quantitative measure of the phase-locking. The goodness-of-fit was tested against the null hypothesis of uniformity by a Rayleigh test. D, Histogram of the distribution into class of phase-locked medial septal neurons (Rayleigh test, p < 0.05 and κ > 0.5) from vehicle (white bar; total phase-locked neurons, n = 19) and Aβ-treated animals (black bar; total phase-locked neurons, n = 21). *p < 0.05; χ2 test for population variance followed by a post hoc binomial test for cell class. E, Firing rate of classified septal neurons as a function of their κ value from vehicle (left panel) and Aβ-treated animals (right panel). Cells with a black outline are the cells with p < 0.05 in the test for uniformity. Light gray triangles, Tonic-firing cells; dark gray circles, slow-firing cells; black squares, rhythmic firing cells. The number of medial septum slow-firing neurons that are phase-correlated to θ waves increased in Aβ-treated rats.