Figure 1.
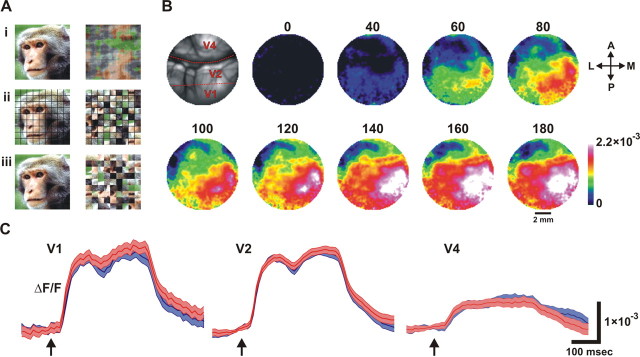
Stimuli and time course of VSDI signal. A, Example of pairs of stimuli (monkey's face and its corresponding scrambled versions). Ai shows scrambling using phase perturbations, and Aii and Aiii show segment scrambling with and without an additional grid, respectively (see Materials and Methods for details). B, Spatiotemporal activation patterns induced by the presentation of coherent face image averaged over 28 trials. Image of the blood vessel patterns (top left, red dashed lines schematically depict the borders between the cortical regions) and a sequence of frames, 20 ms apart, depict VSDI signal over the exposed visual cortex (V1, V2, and V4). Numbers represent time after the onset of the visual stimulus (milliseconds). Abbreviations: A, Anterior; P, posterior; M, medial; L, lateral. C, Time course of response. From left to right: VSDI signal amplitude in V1, V2, and V4 averaged over 427, 445, and 438 pixels, respectively. Blue trace represents the VSDI signal induced by the coherent face stimulus; red trace represents the VSDI signal induced by the scrambled face stimulus as shown in Aiii. Arrows denote the onset of the visual stimulus. Shadow area denotes SEM over 30 trials. The temporal profile averaged over pixels in V1 and V2 areas demonstrates two phases of activation; an early phase that is evoked ∼40 ms poststimulus, and a second late phase demonstrating an increase of activation ∼180 ms poststimulus.

