
Figure 6.
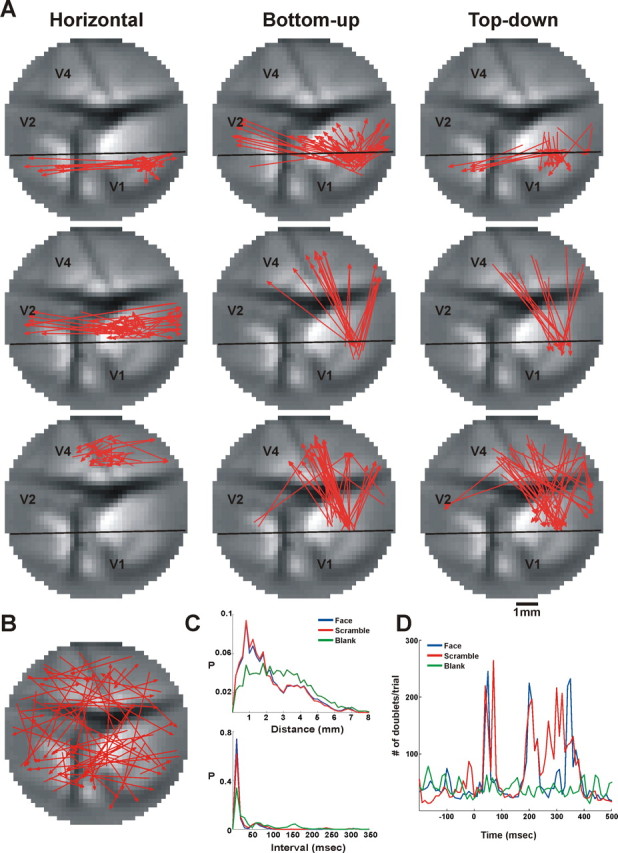
Doublet characteristics. A, Representative doublets significantly repeating in face stimulus trials of a single imaging session. Each doublet is represented as an arrow drawn between the pixels sequentially activated in the pattern. From top to bottom: left column shows examples of horizontal doublets extending within V1, V2, and V4; middle column shows examples of bottom-up doublets (V1→V2, V1→V4, and V2→V4); right column shows examples of top-down doublets (V2→V1, V4→V1, and V4→V2). B, Representative doublets significantly repeating in blank (fixation-only) trials. The doublets shown in A and B were chosen randomly from a single imaging session, making up ∼0.2% of all the significantly repeating doublets from each group. C, The pdfs of doublet distance (top) and time intervals (bottom) that significantly repeat in trials belonging to coherent, scrambled face, and blank conditions. Both the doublet interval and the doublet distance exhibit no significant difference between the scramble and the face stimuli, and both exhibit a significant difference between the stimulus and the blank (Wilcoxon rank-sum test, p < 0.005). D, PSTH of the significantly repeating doublet occurrences; blue, red, and green traces depict face, scrambled, and blank trials, respectively. Data in A–D are taken from a single imaging session, and each stimulus condition included 30 trials. Because the number of significantly repeating doublets was too large to plot them all, only a small fraction of doublets were plotted in A and B. The distributions that appear in C and the PSTH that appear in D include all the significantly repeating doublets occurring in this imaging session.