
Figure 7.
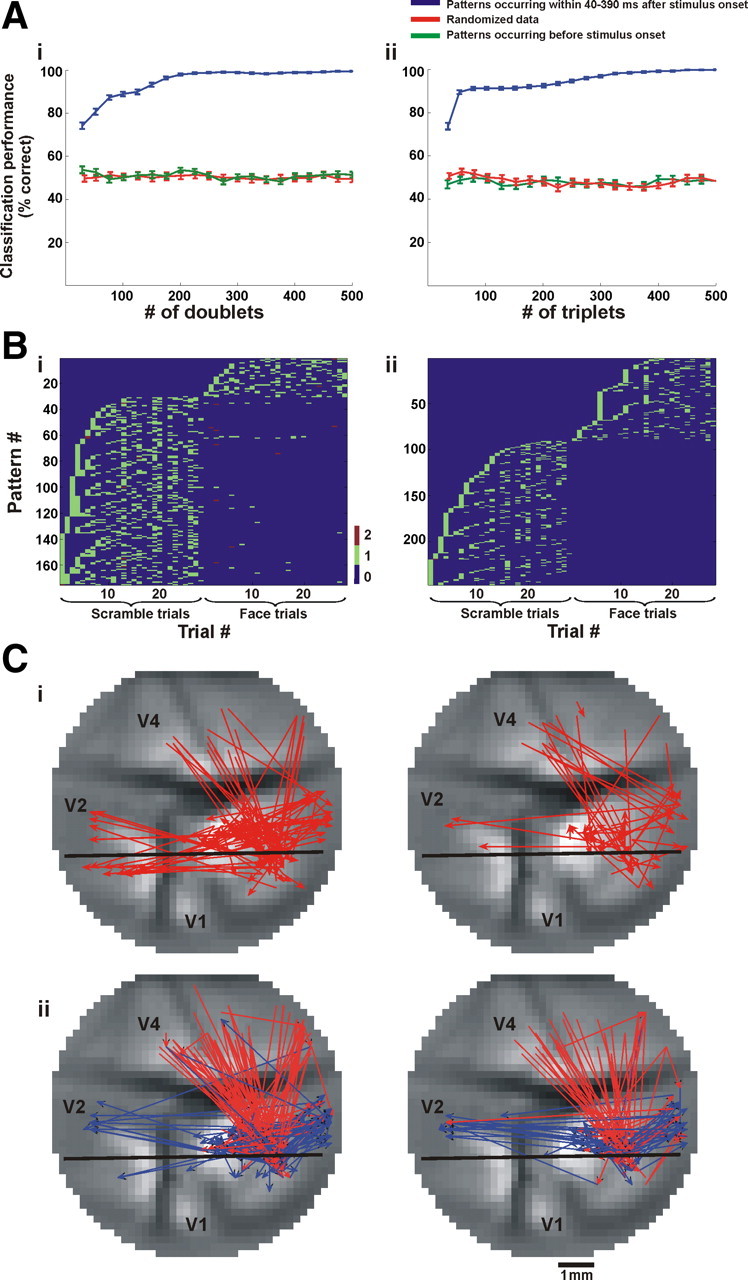
Readout performance of stimulus category using spatiotemporal patterns. A, Performance of binary k-nearest neighbor classifier on single-trial level as a function of the number of patterns used (blue trace, mean ± SEM, n = 50 iterations); red trace denotes performance using patterns occurring in 250 ms time window before stimulus onset (control); green trace denotes performance of the classifier trained with randomized trial category (control). Ai, Performance using doublets. Aii, Performance using triplets. Patterns were chosen according to MI rank order (see Materials and Methods for details). B, The distribution of the most informative patterns (as defined in the text) in single trials of coherent and scrambled conditions. Bi, The175 most informative doublets and their appearance in single trials. Bii, The 247 most informative triplets and their appearance in single trials. The x-axis shows the serial trial number, and the y-axis shows the pattern identification number. Note that most doublets and triplets appear uniquely either in the coherent or scrambled trials. C, The informative patterns. Ci, Doublets occurring most frequently in the scrambled-stimulus trials (left) or in the coherent-stimulus trials (right). Cii, Same as Ci for triplets. Red and blue arrows denote the first and second intervals in the triplet, respectively.