
Figure 1.
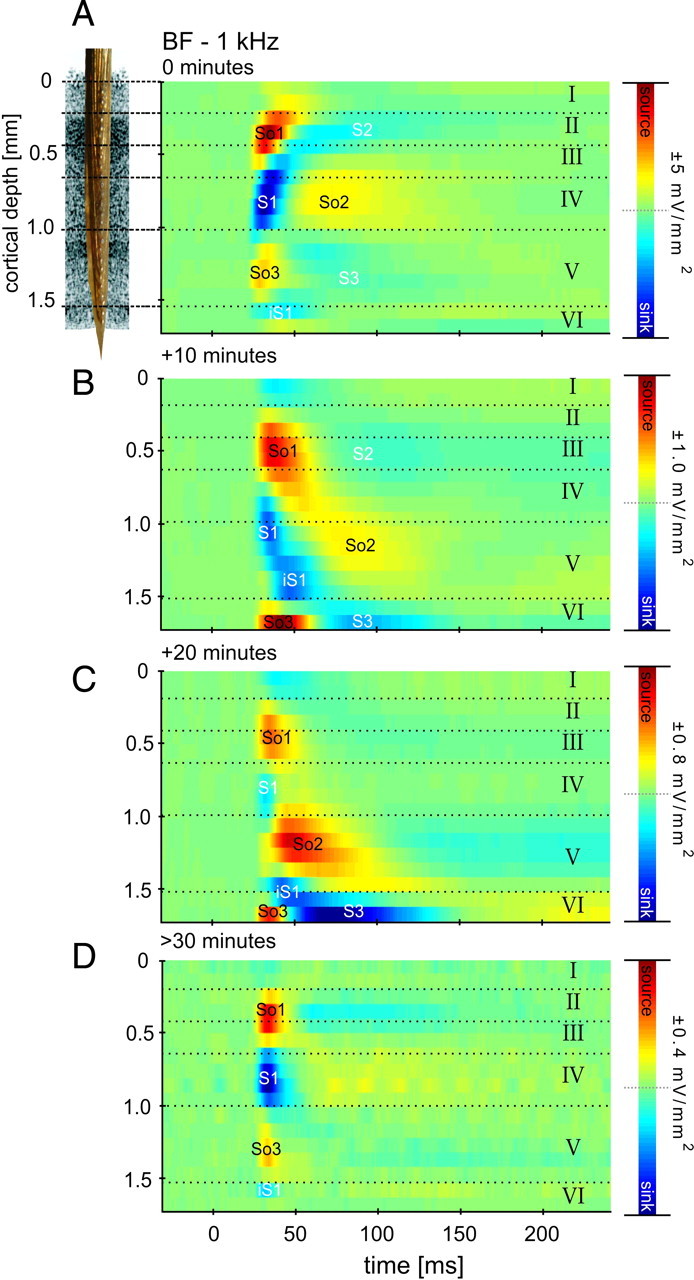
Temporal development of silencing the intracortical contribution of tone-evoked activity in primary auditory cortex. Shown are the CSD profiles across cortical layers (roman numbers) evoked by acoustic stimulation with the BF represented at the measurement site, after different times following topical application of muscimol and SCH50911 to the auditory cortex. Prominent current sources (So1, So2, So3) and current sinks (S1, S2, S3, iS1) are shown in red and blue, respectively. Inset, Custom-made multichannel shaft electrode used for recording. A, Canonical laminar feedforward CSD profile in A1 (for details, see Results). B, At 10 min after application of the silencing mixture, maximum amplitudes of current sources and sinks were reduced to 20% of the original values (see color bar scaling), and the spatial pattern is indicative of diffusion of the mixture from the top layers to the infragranular layers. C, At 20 min after application, amplitudes were further reduced. D, After 30 min, the tone-evoked CSD pattern has stabilized, and CSD amplitude maxima and minima were <10% of the predrug values. Cortical layers were derived from histological analysis of this particular measurement site (supplemental Note 2, animal 1, available at www.jneurosci.org as supplemental material).