Figure 3.
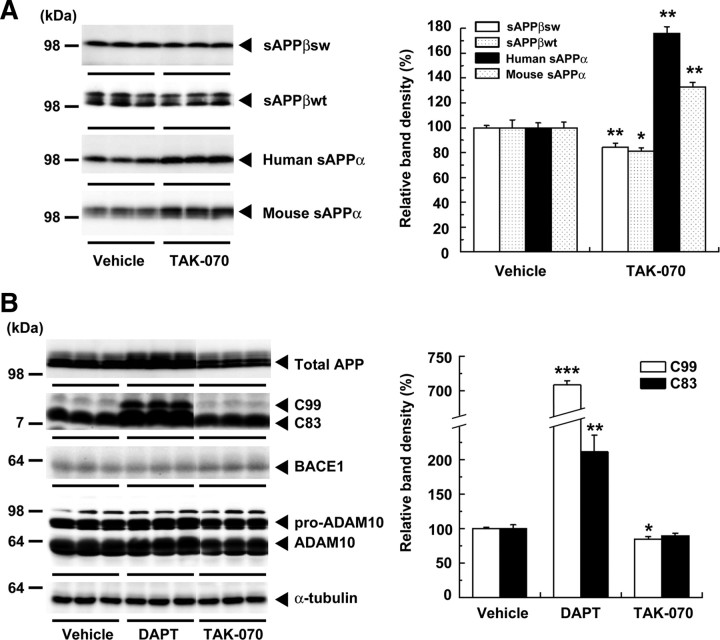
Immunoblot analysis of the protein levels of APP derivatives and those of secretases in N2aAPPsw cells. A, Immunoblots of sAPPβ (sAPPβsw derived from transfected human APPsw and sAPPβwt from endogenous mouse APP) and sAPPα (human sAPPα derived from transfected human APPsw and mouse sAPPα from endogenous APP) in media after treatment with TAK-070 (3 μmol/L) or vehicle from three independent experiments are shown. Values in the graph (right) show the mean percentages of band intensities analyzed by densitometry relative to those in vehicle control (±SEM) in the three independent experiments. *p < 0.05, **p < 0.01, versus vehicle control (Student's t test). B, Immunoblots of APP, C-terminal fragments of APP (C99 and C83), BACE1 and high- and low-molecular-weight forms of ADAM10 (pro- and matured forms, respectively) from lysates of N2aAPPsw cells treated with vehicle, DAPT (3 μmol/L), or TAK-070 (3 μmol/L) are shown. Levels of α-tubulin are shown as an internal control. Note that all the immunoblot data are obtained from a single membrane replica with identical exposure. Values for C99 and C83 (right) are mean percentages of band intensities analyzed by densitometry relative to those in vehicle control (±SEM) in the three independent experiments. *p < 0.05, **p < 0.01, ***p < 0.001, versus vehicle control (Student's t test).

