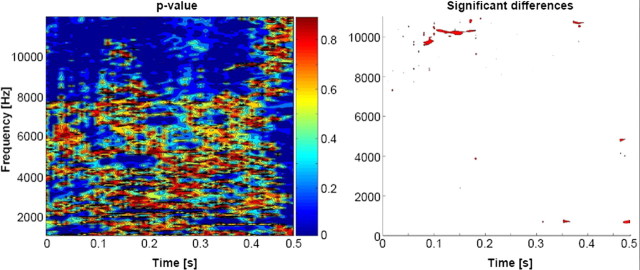
Figure 1.
Statistical comparison of stimuli. Left, The spectrogram of each stimulus was generated and comparisons (nonparametric t tests) were performed across groups of sounds for each ∼5 ms and ∼80 Hz time–frequency bin. Right, Bins meeting the following statistical criteria are displayed as red: eight spatially contiguous bins (equivalent to a cluster-level value of p < 0.00625).

