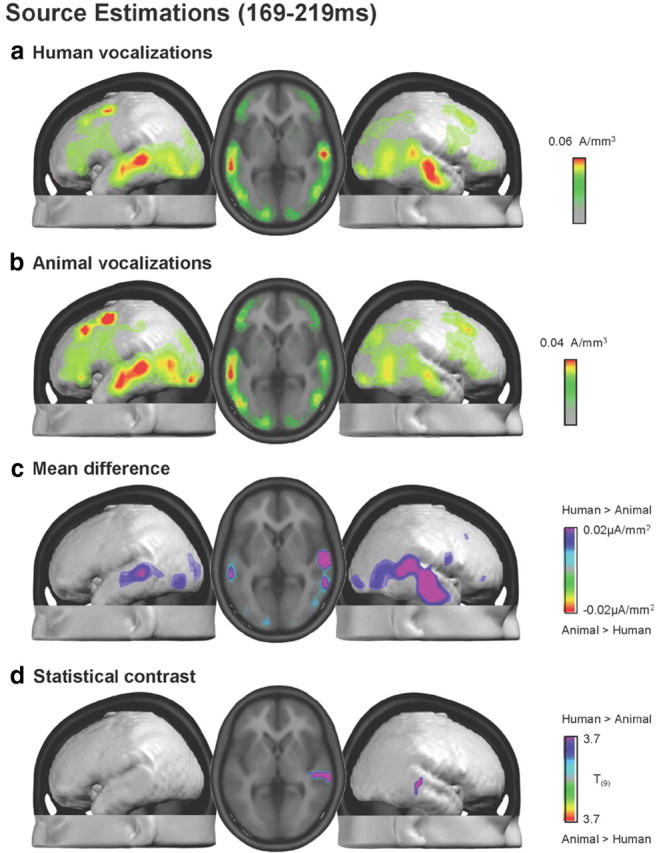
Figure 5.

a, b, Group-averaged distributed linear source estimations were calculated over the 169–219 ms poststimulus period for each experimental condition. Results are rendered on the average MNI brain. Axial slice shows the activations for each of the two conditions in correspondence to the maximal t value at 47, −22, 6 mm. c, Mean difference in source estimations included a distributed set of regions. The scaling for this difference is one-half that of the maximum for the estimations in response to animal vocalizations. d, Results of the statistical contrast of the source estimations between AEPs to human and animal vocalizations are displayed in the same manner as in a and b.
