Figure 4.
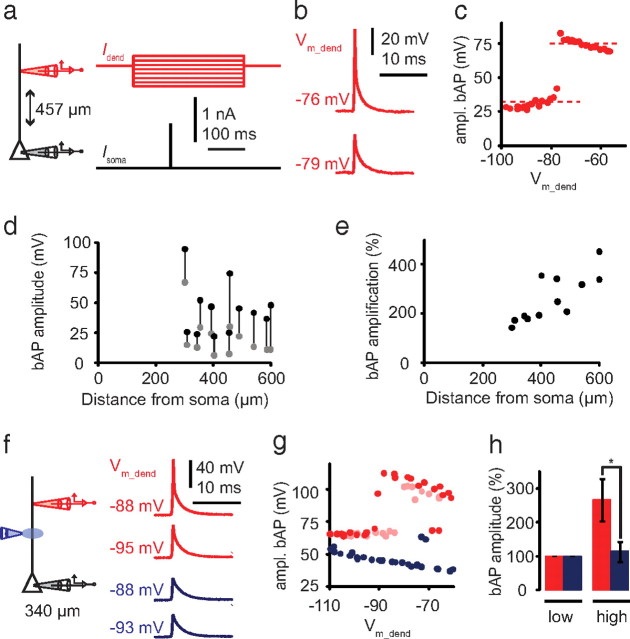
Abrupt increase in bAP amplitude with dendritic current injection dependent on dendritic Na+ channels. a, Experimental setup with the dendritic electrode in red and the somatic electrode in black. The dendritic membrane potential was controlled by dendritic current injection for 300 ms with varying amplitude (red traces) starting 100 ms before a 2 ms current injection at the soma (black trace) that evoked an AP. b, bAPs recorded 457 μm from the soma (red traces) at different dendritic membrane potentials (Vm_dend). c, Example of bAP amplitude as a function of Vm_dend in one cell. Dashed lines indicate average values before and after the abrupt increase in amplitude (low and high, respectively). d, High (black circles) versus low (gray circles) amplitudes of bAPs in all cells recorded as a function of distance from soma. e, Relative amplification of bAP amplitude with respect to the low level as a function of distance from soma. f, Left, Experimental setup for local blockade of dendritic Na+ channels. Dendritic and somatic recording electrodes are in red and black, respectively, and the TTX puffing pipette is in blue. Right, bAPs recorded 340 μm from soma at different Vm_dend in control conditions (red traces) and during the local application of TTX (blue traces). g, bAP amplitude as a function of Vm_dend of the same cell in control conditions (red circles), after application of TTX (blue circles), and after washout (pink circles). h, bAP amplitude in percentage at low and high Vm_dend, in control conditions (red bars), and during local application of TTX (blue bars). Asterisk indicates statistical significance using a paired, one-tailed t test (n = 3; p = 0.004).

