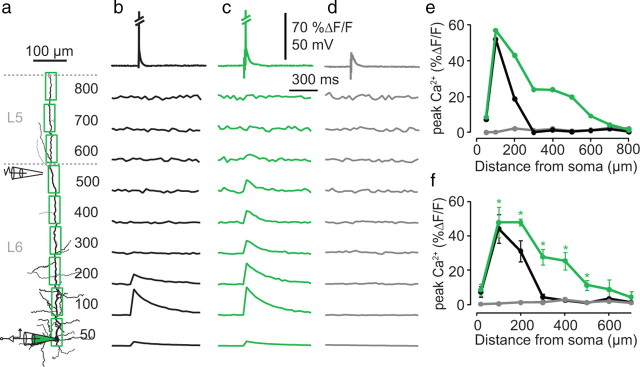
Figure 5.
Ca2+ influx along the apical dendrite due to bAPs. a, Reconstructed L6 pyramidal neuron showing the regions of interest used for measuring Ca2+ influx (green squares) along the apical dendrite (numbers to the right indicate the distance from the soma). A somatic recording electrode (green) was used to fill the cell with the calcium indicator OGB-1 (100 μm) and evoke a single bAP. A second extracellular stimulation electrode was placed close to the dendrite (<∼10 μm) at the border of L5 and L6. b, Example of bAP (top trace) that evoked fluorescence increases (lower traces) for the first 200 μm along the apical dendrite under control conditions. Diagonal slashes in top trace indicate truncation of the somatic AP. c, bAP-evoked fluorescence measurements along the same dendrite with simultaneous synaptic stimulation. d, Synaptic stimulation (top trace) alone showing no detectable Ca2+ influx (bottom traces). e, Fluorescence profile for all distances measured in the cell shown in a–d. f, Average fluorescence profile for five cells. Error bars indicate the SEM. Asterisks indicate statistical significance between the control condition versus synaptic stimulation (n = 5; p = 0.007, 0.02, 0.007, 0.006, 0.024, in order from left to right).

