Figure 6.

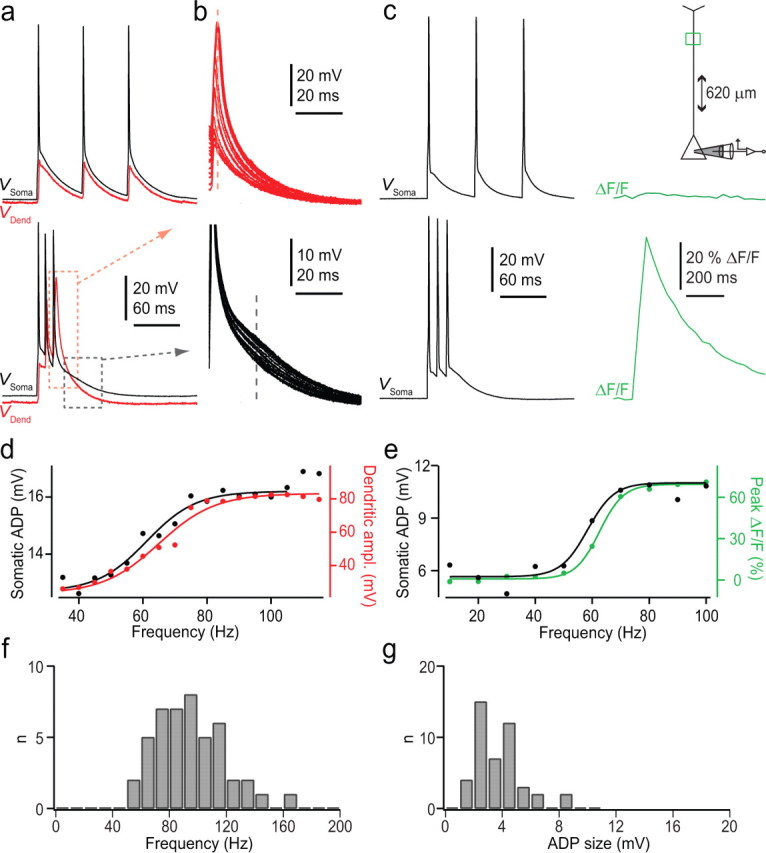
Critical frequency for dendritic electrogenesis. a, Dual somatic (black trace) and dendritic (red trace) recordings from a L6 pyramidal neuron. Responses to brief trains of APs at 10 (top) and 140 Hz (bottom) evoked by three brief somatic current injections (2 ms each). The resting membrane potential at the soma and at the dendrite was −77 and −82 mV, respectively. The soma was 1540 μm from pia and the dendritic recording pipette was localized 354 μm from soma. b, Overlay of the last AP in the train of three APs at different frequencies of 40 to 150 Hz for dendritic (top) and somatic (bottom) recording. The peak amplitude (and width) of the last AP recorded at the dendrite increased in a nonlinear manner. This was also reflected in an increase in depolarization after the last AP (ADP) at the soma (time point indicated by the dashed line). c, Measurements of [Ca2+]i in a region of interest (green box) in the apical dendrite following low (top) and high (bottom) frequency trains of APs as in a and b. d, Dendritic and somatic potentials measured at the time point indicated with dashed lines in a and b shown as a function of AP frequency. e, Somatic after-depolarizing potential and fluorescence measurements from c shown as a function of AP frequency. f, Histogram of critical frequency measured from 46 neurons. g, Histogram of somatic after-depolarizing potential values from the same neurons as in f.
