
Figure 7.
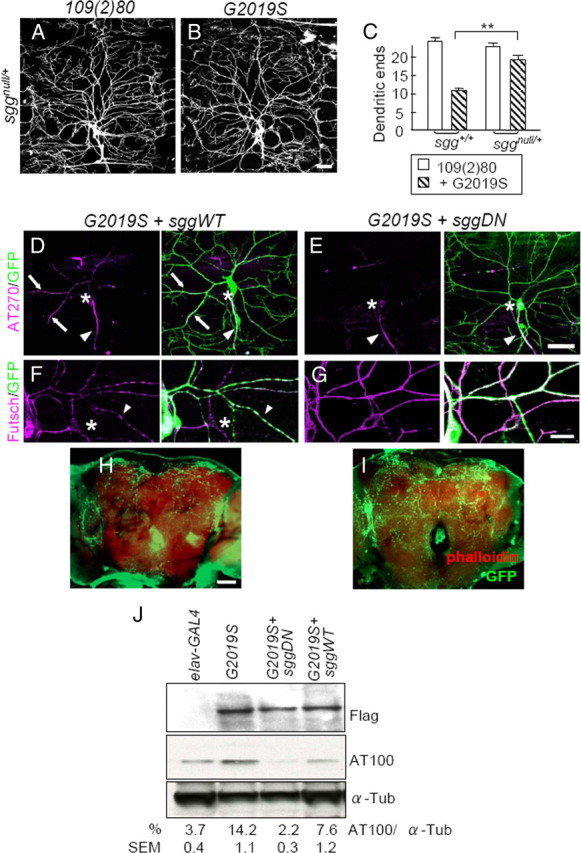
Sgg suppresses G2019S-induced dendrite degeneration. A, B, Images of dorsal DA dendrites in A6 segments of third instar larvae of 109(2)80 (A) or G2019S (B) in an sggnull/+ background. Dendrites are marked by coexpressed mCD8GFP. C, Quantification of dendritic ends for 109(2)80 (n = 7), G2019S (n = 8), sggnull/+ (n = 11), and sggnull/+;G2019S (n = 11). Averages are the mean ± SEM of dendritic ends per 10,000 μm2 area, and significance is compared by Mann–Whitney test with **p < 0.01. D–G, ddaC neurons marked by ppk-GAL4-driven mCD8GFP with coexpression of G2019S + sggWT (D, F) or G2019S + sggDN (E, G). D, E, AT270 (magenta) and GFP (green) staining. The axons (arrowheads), cell bodies (asterisks), and dendrites with tau signals (arrows) are indicated. Scale bar is 50 μm. F, G, Futsch staining (magenta). Arrowheads indicate dendrites with discontinuous Futsch expression, and asterisks mark dendrites containing no Futsch signals. H, I, Whole-mount adult brains shows dendrites of dopaminergic neurons marked by ddc-GAL4, UAS-dscam [TM1]-GFP, as done for Figure 2, A and B. Projected images show reduced GFP signals (green) in adult brains (costained with Phalloidin, red) of G2019S + SggDN compared to G2019S + sggWT control at 2 weeks after eclosion. J, Western blot analysis of adult brain lysates of elav-GAL4 control or elav-GAL4-driven G2019S, G2019S + sggWT, and G2019S + sggDN by Flag, AT100, or α-Tubulin (α-Tub). The immunoreactivities of AT100 are shown as percentages to those of α-Tub, averaged from three independent experiments. Scale bars: B (for A, B), E (for D, E), H (for H, I), 50 μm; F (for F, G), 15 μm.