Fig. 2.
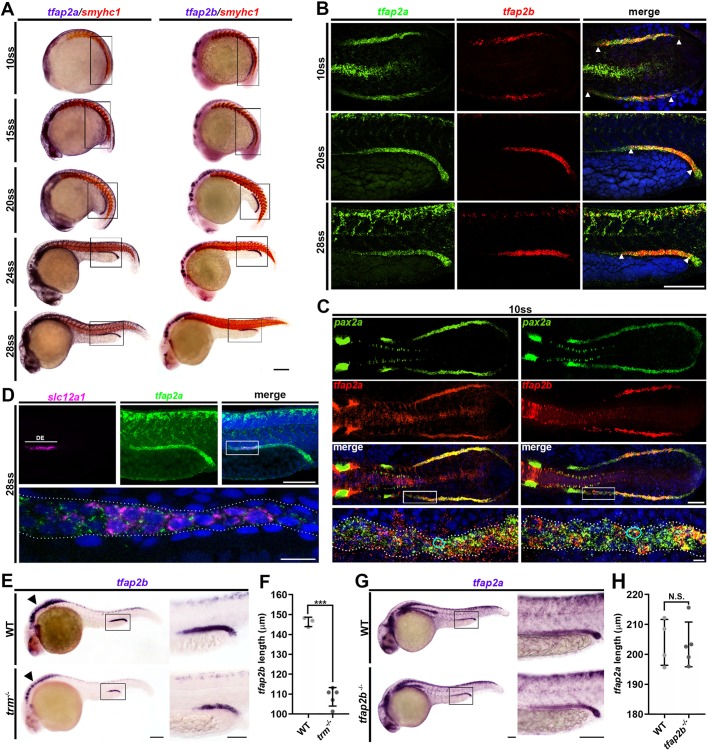
tfap2a and tfap2b are expressed in dynamic overlapping domains in developing nephrons, where tfap2a acts upstream of tfap2b. (A) Whole-mount in situ hybridization for tfap2a and tfap2b expression (purple), and smyhc1 expression (red). Black boxes indicate pronephros expression. Scale bar: 200 µm. (B) Fluorescent in situ hybridization for tfap2a (green) and tfap2b (red) in 10 ss (flat mount), 20 ss and 28 ss wild-type embryos (lateral views). White arrowheads indicate overlap. Scale bar: 70 µm. (C) Fluorescent in situ hybridization for pax2a (green), tfap2a (red) and tfap2b (red) in 10 ss wild-type embryos. White boxes outline the region shown in more detail in the bottom panel. Cyan circles indicate example cells co-expressing pax2a and tfap2a or tfap2b. White dots indicate the renal progenitor field border. Scale bars: 100 µm (top) and 10 µm (bottom). (D) Fluorescent in situ hybridization for slc12a1 (magenta) and tfap2a (green). White box indicates the area shown in more detail below. Scale bars: 70 µm (top) and 10 µm (bottom). (E) Whole-mount in situ hybridization for tfap2b. Arrowhead indicates hindbrain. Scale bars: 100 µm (left) and 70 µm (right). (F) Absolute length quantification of tfap2b. (G) Whole-mount in situ hybridization for tfap2a. Scale bars: 70 µm. (H) Absolute length quantification of tfap2a. n≥3. Measurements compared using unpaired t-tests. Data are mean±s.d. ***P<0.001; N.S., not significant.

