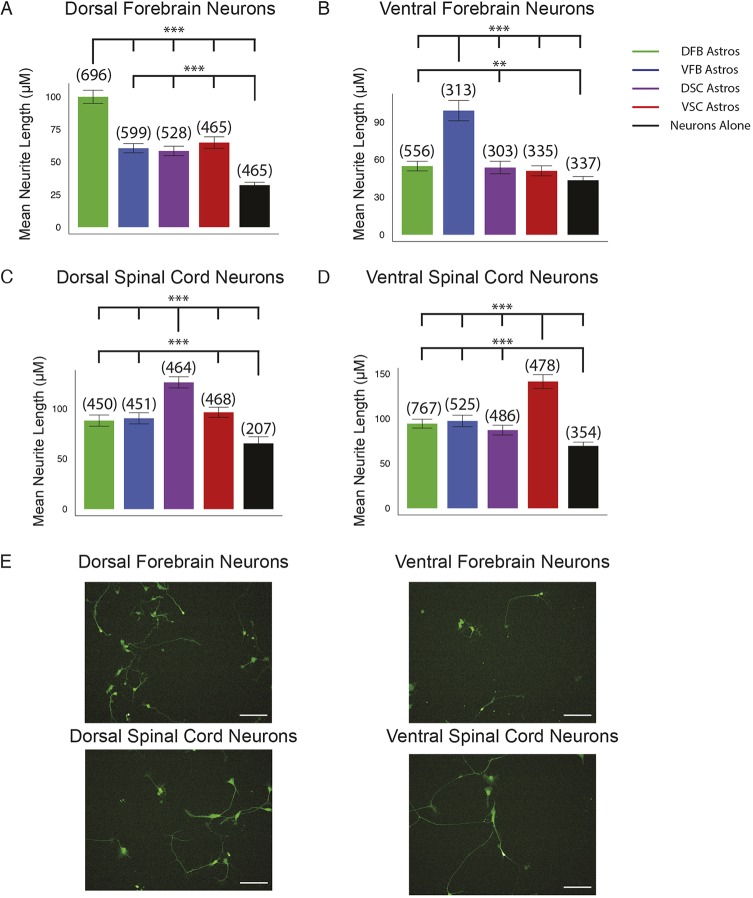
Fig. 5.
Neurite outgrowth of regional neurons in co-culture. (A-D) The length of neurites from regionally specified ESC-derived neurons in co-culture with the indicated ESC-derived regional astrocytes measured after 3 days in co-culture or plated alone. The length of the longest neurite of each neuron was measured. Bar graph is of average neurite length. Error bars represent 95% confidence interval. Numbers in parenthesis represent total number of neurites counted for each group over three biological replicates. (**P<0.01, ***P<0.001, Kruskal–Wallis test). (E) Representative images of regional neurons plated on matched regional astrocytes. Scale bars: 100 μm.

