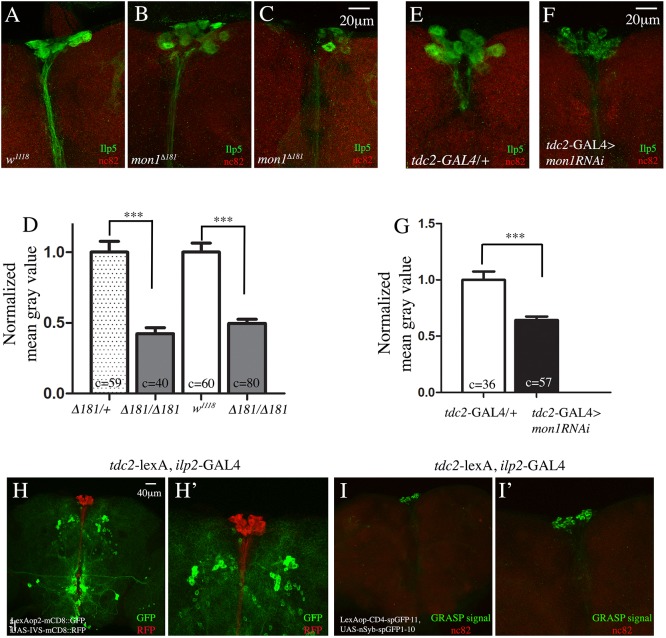
Fig. 5.
mon1 in OPNs regulates ilp5, and OPNs make direct synaptic connections with the IPCs. (A-C) Adult brains of w1118 (A) and mon1Δ181 mutants (B,C) stained using anti-ILP5 (green) and anti-Brp (red) antibodies. There is a distinct decrease in the intensity of ILP5 staining in the mutants (B,C). In a few cases, the IPCs exhibit only faint staining around the edge of the cells (C). (D) Quantification of the staining intensity shows, on average, a 50% reduction in staining intensity between control and mutants [mon1Δ181/+, 1.0±0.07 (c=59 cells, N=6) versus 0.43±0.04 (c=40 cells, N=6) in mon1Δ181; w1118, 1.0±0.06 (c=60 cells, N=6) versus 0.49±0.3 (c=80 cells, N=7) in mon1Δ181]. (E-G) Adult brains of tdc2-GAL4/+ (E) and tdc2-GAL4>UAS-mon1RNAi (F) stained using anti-ILP5 (green) and anti-Brp (red) antibodies. Intensity of ILP5 staining in the IPCs is reduced in upon downregulation of mon1 in OPNs (compare F with E). (G) The decrease in intensity is ∼40% [tdc2-GAL4/+, 1.00±0.07 (c=36, N=5) versus 0.63±0.03 (c=57 cells, N=8) in tdc2-GAL4>UAS-mon1RNAi]. (H,H′) Adult brain of a tdc2-lexA, ilp2-GAL4>lexAop-mCD8GFP, UAS-IVS-mCD8::RFP animal stained using anti-GFP (green) and anti-RFP (red) antibodies. The organization of the two sets of neurons is shown (H). A more detailed image of H is shown in H′. (I,I′) Adult brain of a tdc2-lexA, ilp2-GAL4>LexAopCD4-spGFP11, UAS-nSyb-spGFP1-10 animal. Localized GFP staining representing the GRASP signal is seen at the IPCs alone (I). A more detailed image of I is shown in I′.

