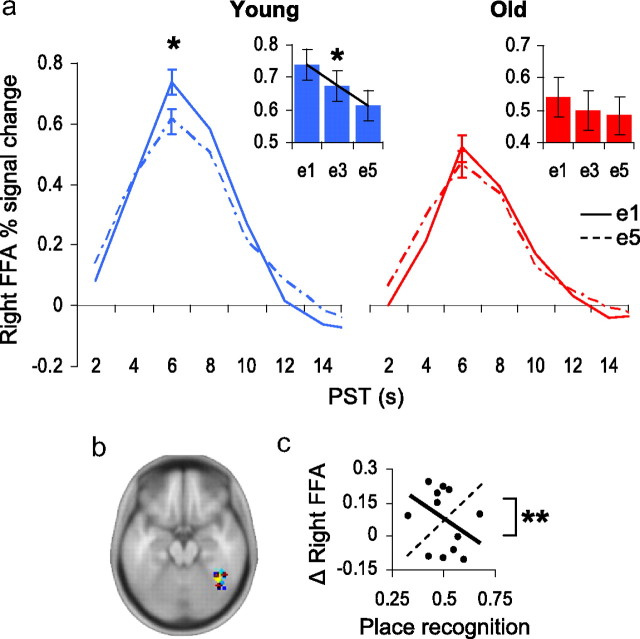
Figure 3.
Age differences in the fusiform face area (FFA). a, Young adults (blue) exhibited a significant linear effect of FFA adaptation to repeated attended faces. Maximal repetition-related adaptation was detected between the first and fifth exposures. For older adults (red), no significant effects of face repetition were detected in the FFA. Inset box-plots: Percentage signal change in right FFA (y-axis) at exposures e1, e3, and e5 (x-axis); linear F contrast: *p = 0.04. Impulse response function plots: Percentage signal change in right FFA (y-axis) at e1 (solid line) and e5 (hashed line) plotted over peristimulus time (x-axis); within-subjects t test: *p = 0.02. b, Locations of individual FFAs; see supplemental Table S2, available at www.jneurosci.org as supplemental material. c, For older adults, the brain–behavior regression slope for FFA adaptation was not significant by itself, but was significantly different from the slope for the PPA brain–behavior relationship (hashed trend-line), t test: **p < 0.01, indicating that those older adults exhibiting the strongest post-task place recognition accuracy had highest magnitudes of PPA adaptation and, additionally, the lowest magnitudes of FFA adaptation.

