Figure 5.
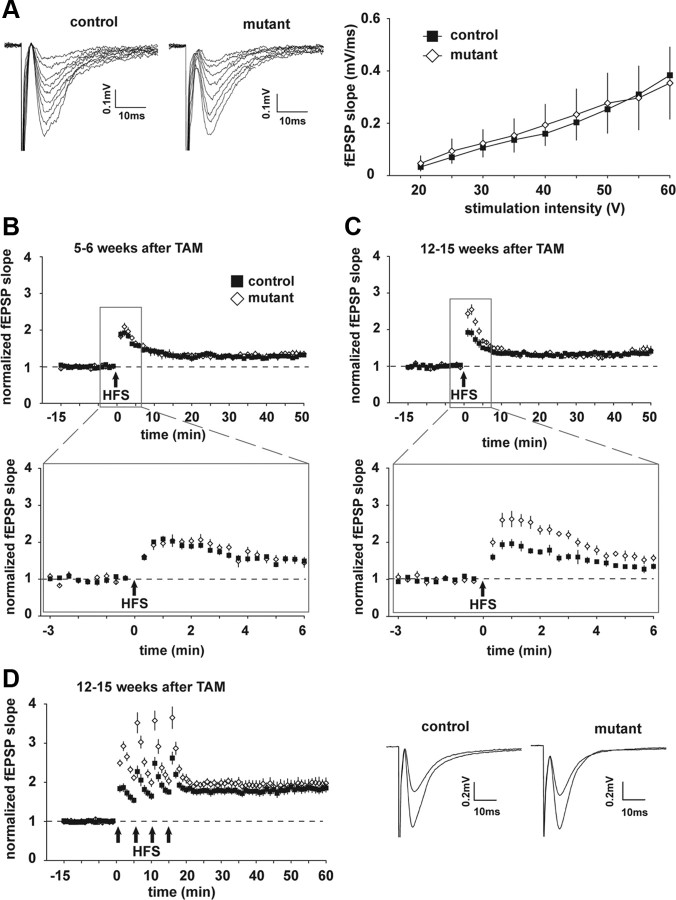
Synaptic transmission and plasticity in hippocampal slices. A, Left, Representative fEPSPs recorded in area CA1 of both genotypes when stimulating Schaffer collaterals with increasing stimulation intensities. Right, Input/output relationships 12–15 weeks after induction of the Dicer mutation (each n = 3). B, At 5–6 weeks after induction of mutation, tetanic stimulation [i.e., high-frequency stimulation (HFS)] induced PTP (control, 1.88 ± 0.08, n = 8 slices from 4 mice; mutant, 1.94 ± 0.11, n = 8 slices from 4 mice; p = 0.59) and LTP (control, 1.29 ± 0.05, n = 8 slices from 4 mice; mutant, 1.34 ± 0.08, n = 8 slices from 4 mice; p = 0.62). Bottom, Expanded time course. C, At 12–15 weeks after induction of mutation, PTP was higher in the mutant than in control (PTP: control, 1.76 ± 0.10, n = 8 slices from 3 mice; mutant, 2.39 ± 0.14, n = 8 slices from 3 mice; p < 0.01; LTP: control, 1.34 ± 0.05, n = 8 slices from 3 mice; mutant, 1.39 ± 0.08, n = 8 slices from 3 mice; p = 0.6). D, At 12–15 weeks after induction of mutation, repeated HFS induced higher PTP each time after HFS, but LTP remained comparable in both genotypes (control, 1.84 ± 0.1, n = 9 slices from 3 mice; mutant, 1.98 ± 0.13, n = slices from 3 mice; p = 0.41). In both genotypes, four times HFS induced higher LTP than single HFS (p < 0.05). The traces show the mean of 45 and 30 consecutive fEPSPs before and 40–50 min after single HFS in both genotypes, respectively. TAM, Tamoxifen.

