Figure 6.
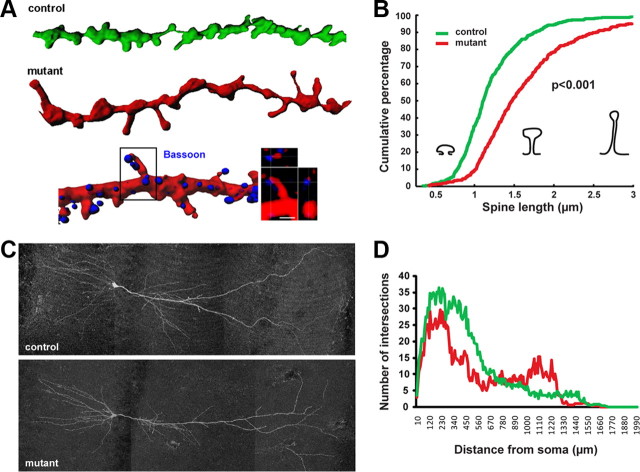
Altered morphology of dendritic spines and the expression level of synaptic proteins in mutant animals. A, Three-dimensional reconstruction of dendrites from control and mutant animals 12 weeks after induction of the Dicer1 gene mutation. A visualization of synaptic connections by the presynaptic marker Bassoon (in blue). B, An increase in the length of dendritic spines in CA1 hippocampal neurons of Dicer1CaMKCreERT2 mutant mice compared with controls (control, n = 5; mutant, n = 6; average total length of analyzed dendrites per animal was 140 μm). C, Representative pictures showing morphology of control and mutant CA1 area neuron (filled with biocytin) 15 weeks after induction of the Dicer1 gene mutation. D, Sholl analysis of dendritic tree of CA1 neurons performed 15 weeks after induction. For analysis, all dendrites of individual neurons were traced, and statistical analysis was performed by repeated-measures ANOVA. There is no significant difference in dendritic tree arborization between control and mutant mice (p = 0.4; F(1,172) = 0.78). An interaction between the genotype and the distance from the soma (dependent variable categorical predictor, p < 0.01; F(1,172) = 1.53) indicates a shift in the neuronal arborization toward the more distal dendrites in mutants.

