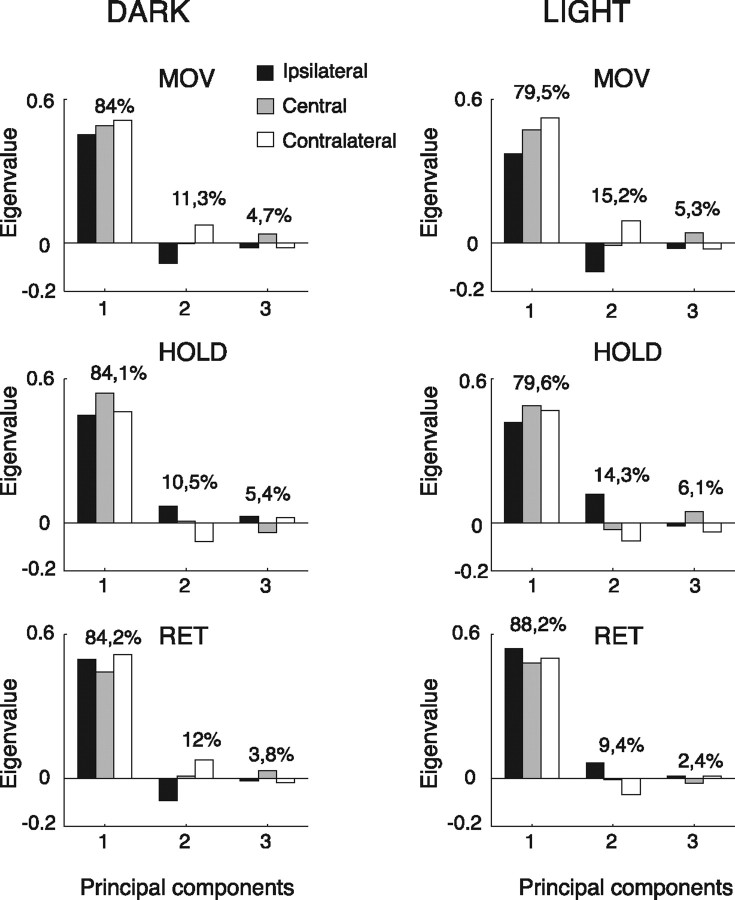
Figure 10.
Principal component analysis of reaching movements. Each plot shows the relative weight (in percentage) of the eigenvectors of the three principal components. Each eigenvector includes three conditions corresponding to the ipsilateral (black), central (gray), and contralateral (white) direction of movement with respect to the recording site.

