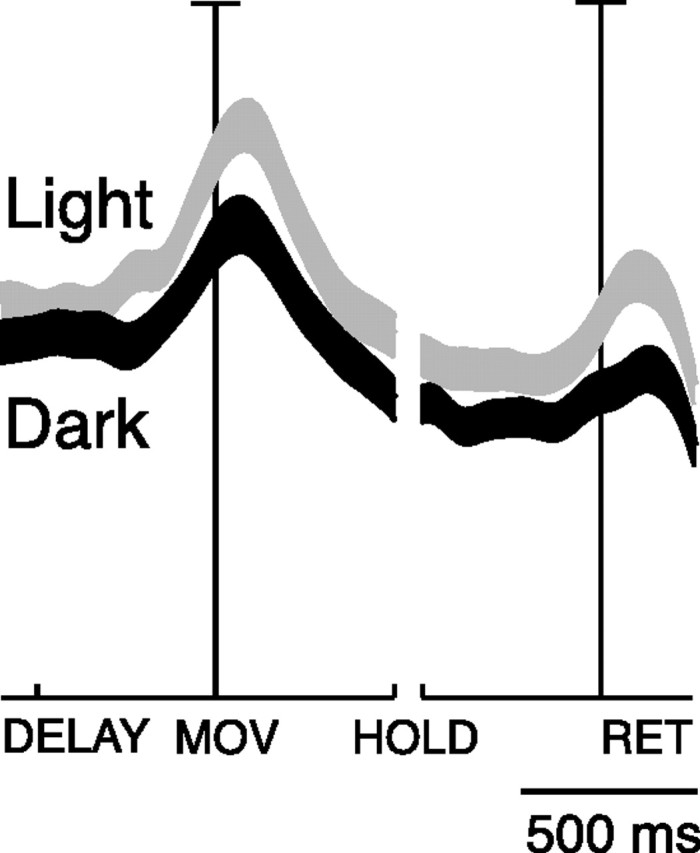
Figure 8.

Effect of task conditions (vision and absence of vision) on reaching activity of V6A cells: population behavior. Average SDF of the cells tested in the light (gray line) and in the dark (black line). Preferred directions were taken into account. Each cell was taken into account twice: once when it showed the highest peak activity in light (preferred direction), and another when it showed highest peak activity in dark. The thickness of SDF lines indicates the variability band (SEM). The activity of cells in each plot was aligned twice on the onset of arm movement and on the onset of return movement. Permutation test between light and dark in DELAY, NS; in MOV, HOLD, RET, p < 0.05).
