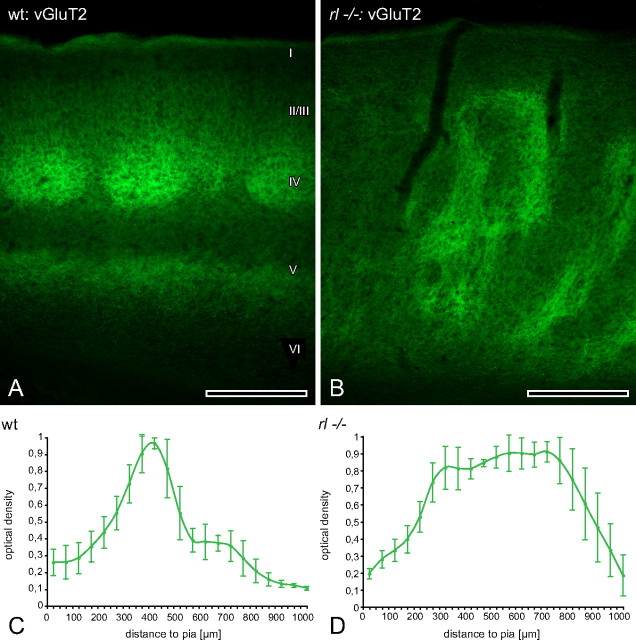
Figure 6.
Mapping of thalamic bouton distribution across layers. A, In wild-type (wt) animals vGluT2 immunoreactivity faithfully reflected the distribution of terminal fields of lemniscal thalamic projections to the barrel cortex. A highly dense, modular termination pattern in layer IV and two other dense but band-like termination patterns in layer I and VI could be appreciated. B, In reeler (rl−/−) a completely different mode of termination became obvious. Here, bands of terminal boutons, which merged and separated again, spanned much of the cortical thickness. At several depths some larger patches were included in these bands. C, D, Quantification of the optical density of thalamic boutons immunoreactive for vGluT2. Note that the two curves are very different from each other and bear a high similarity in shape to the respective RORB ones (Fig. 3C,D). Roman numerals indicate cortical layers. Scale bars, 250 μm.

