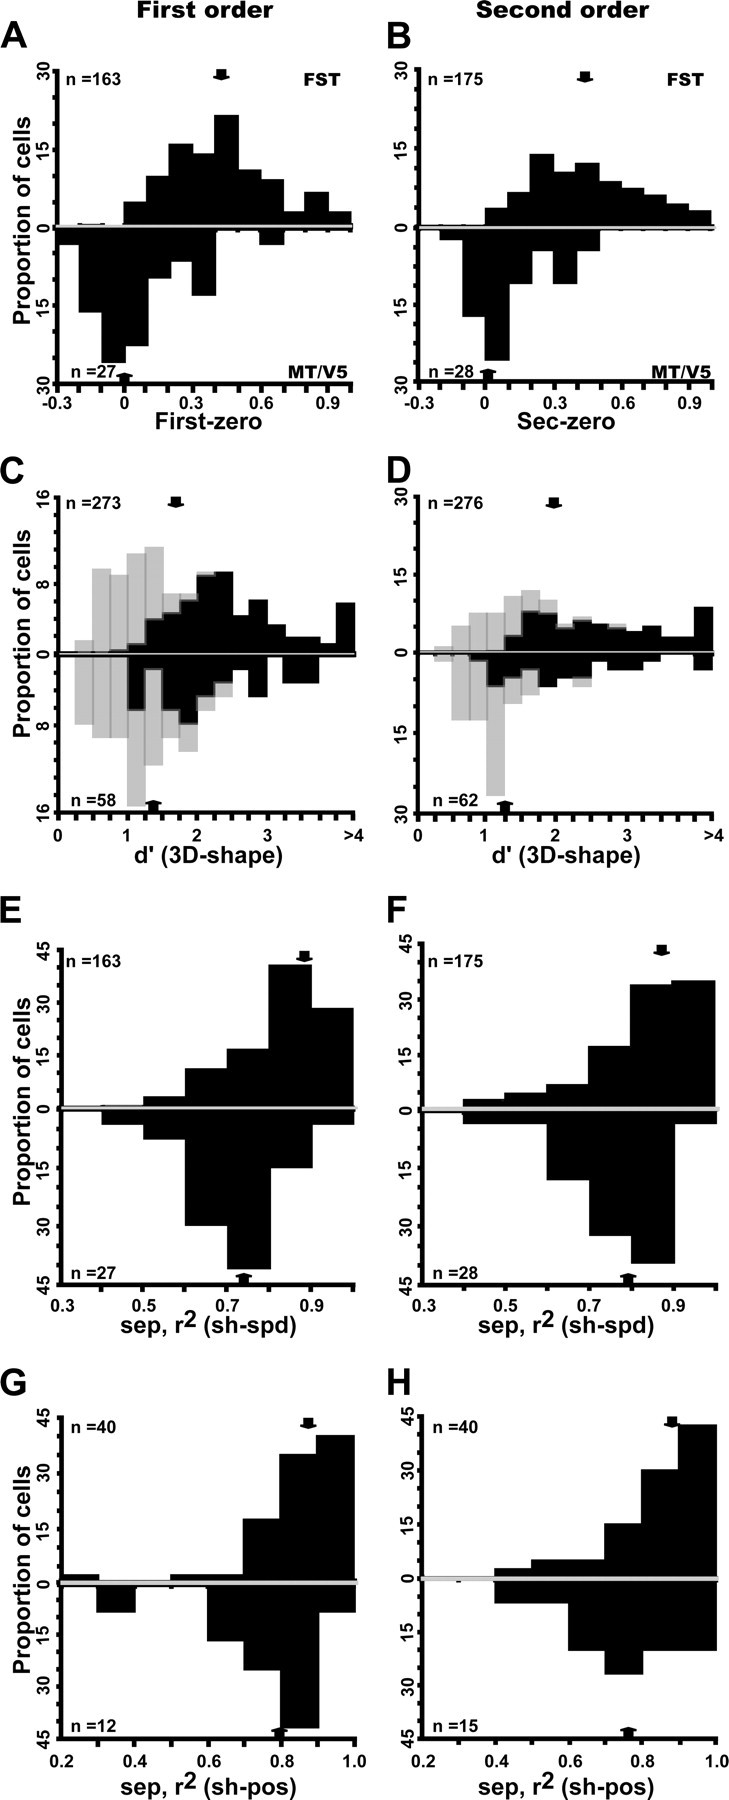
Figure 12.

Comparison of MT/V5 (below) and FST (above) neurons selective for first-order (A, C, E, G) and second-order (B, D, F, H) stimuli. A, B, Distribution of index [(Rnz − Rz)/(Rnz + Rz)], where Rnz and Rz are responses to nonzero and zero order, respectively; first-order FST median, 0.42 (0.27–0.58); MT/V5 median, 0.06 (−0.06 to 0.12). Distribution significantly higher for FST (Z = 7.05, p < 10−7, Mann–Whitney U test); second-order FST median, 0.42 (0.28–0.62); MT/V5 median, 0.06 (−0.02 to 0.23). Distribution significantly higher for FST (Z = 6.06, p < 10−5, Mann–Whitney U test). C, D, Distribution of d′ (for 3D shape): light and dark hatching indicate nonselective and selective according to ANOVA): first-order FST median, 1.7 (1.05–2.44); MT/V5 median, 1.43 (0.98–1.9); second-order FST median, 1.9 (1.34–2.9); MT/V5 median, 1.27 (1.02–2.1). E, F, Distributions of 3D shape–speed separability index; first-order FST median, 0.87 (0.79–0.90); MT/V5 median, 0.74 (0.67–0.86); second-order FST median, 0.88 (0.75–0.92); MT/V5 median, 0.80 (0.78–0.85). G, H, Distributions of 3D shape–position separability index: first-order FST median, 0.88 (0.82–0.93); MT/V5 median, 0.8 (0.7–0.89); distribution difference NS; second-order FST median, 0.88 (0.79–0.95); MT/V5 median, 0.78 (0.7–0.84). Difference significant (Mann–Whitney U test, Z = 1.98, p < 0.05). Arrows indicate median values.
