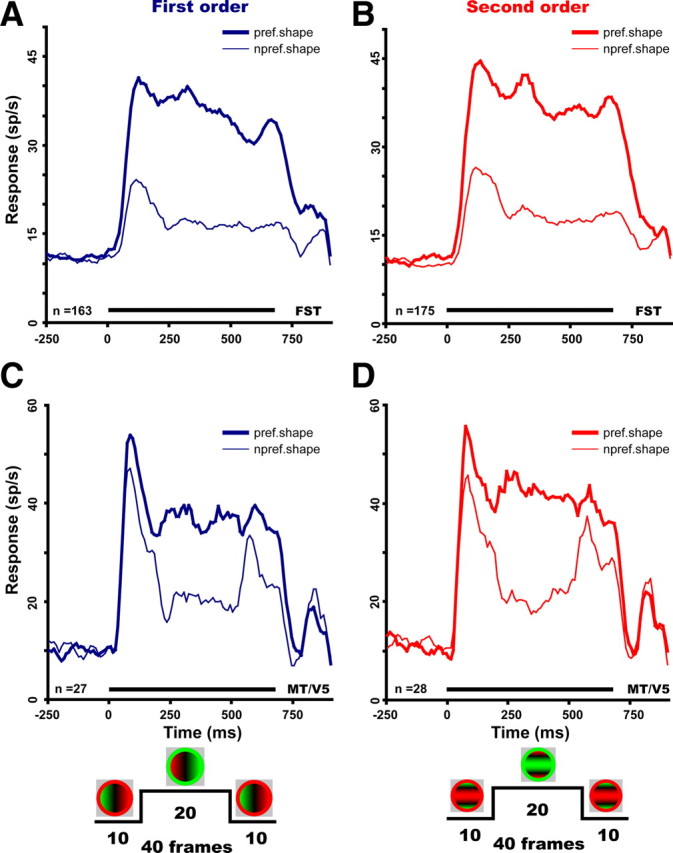
Figure 14.

Population response as a function of time for preferred (thick line) and nonpreferred (thin line) values of first-order (A, C) and second-order (B, D) depth–structure in FST (A, B) and MT/V5 (C, D) selective neurons. Numbers are indicated. Curves are smoothed (boxcar smoothing, 50 ms). In FST, the difference (paired t test, 2 consecutive bins also significant, p < 0.05) between preferred and nonpreferred stimulus became significant at 50 ms compared with 90 ms in MT/V5. Differences between preferred and nonpreferred responses remained significant throughout the stimulus duration (including during the direction reversal) in FST but not in MT/V5. Insets at the bottom show the time courses of the stimulation for a first-order gradient on the left and a second-order gradient (ridge) on the right.
