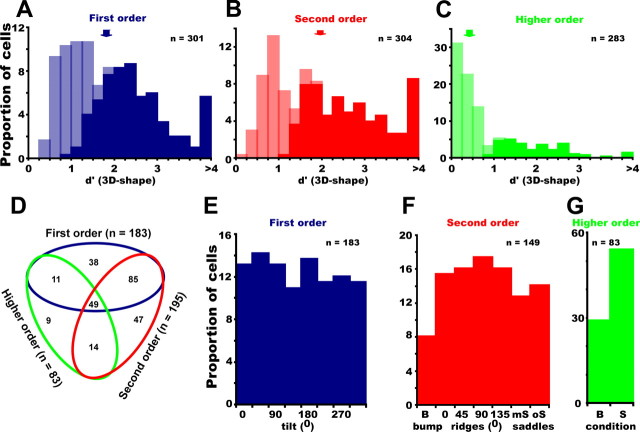
Figure 3.
Selectivity of FST neurons: A–C, Distributions of d′ for first-order (A), second-order (B), and higher-order (C) responsive FST neurons; light and dark hatching indicates selective and nonselective neurons, respectively, based on two-way ANOVA (p < 0.0167). D–G, Stimulus preferences: number of neurons selective for the three orders of stimuli (D). A neuron can be selective for multiple orders. E–G, Distribution of optimal stimuli for first-order (E), second-order (F), and higher-order (G) selective FST neurons. B, Bump; S, saddle.

