Figure 6.

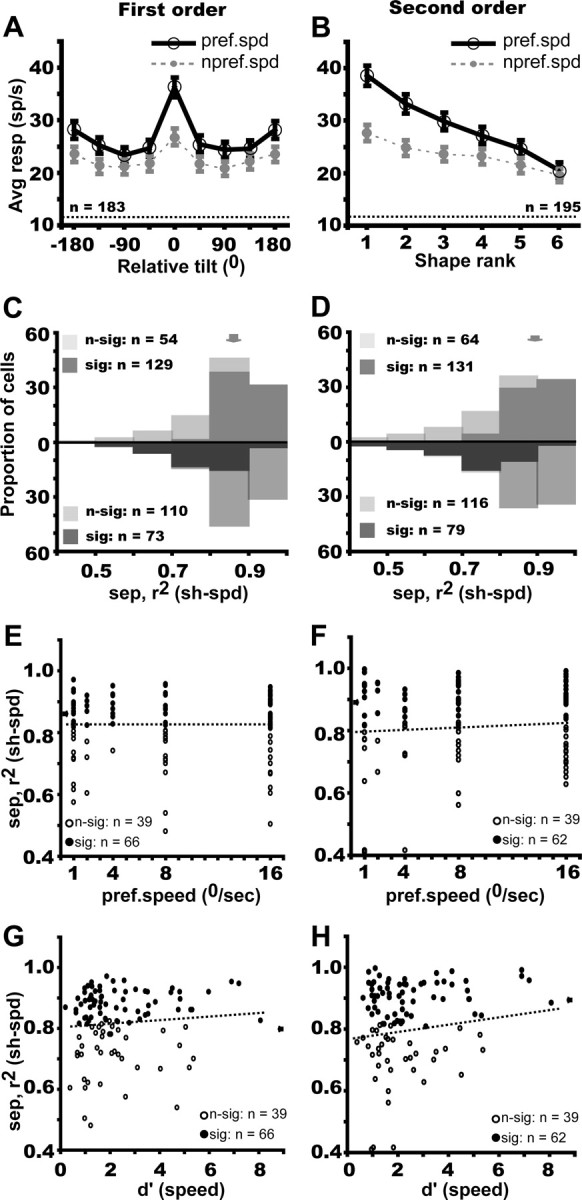
Speed tolerance of FST neurons selective for first-order (blue, A, C, E, G) and second-order (red, B, D, F, H) stimuli. A, B, Average gross responses for preferred (black solid lines) and nonpreferred (gray dashed lines) speeds plotted a function of relative tilt and rank in descending order of preference (both determined at preferred speed). C, D, Distribution of the (3D shape–speed) separability index for first- and second-order selective neurons; light and dark hatching indicates, respectively, nonsignificant and significant neurons according to the permutation test (top row) and bootstrapping test (bottom row). Arrows indicate median values. E, F, Separability index plotted as a function of preferred speed: r2 = 0.0006, NS and r2 = 0.009, NS, respectively. G, H, Separability index plotted as a function of d′ for speed: r2 = 0.012, p < 0.02 and r2 = 0.054, NS, respectively. Contrary to the prediction, the speed tolerance slightly increases with d′ for speed.
