
Figure 7.
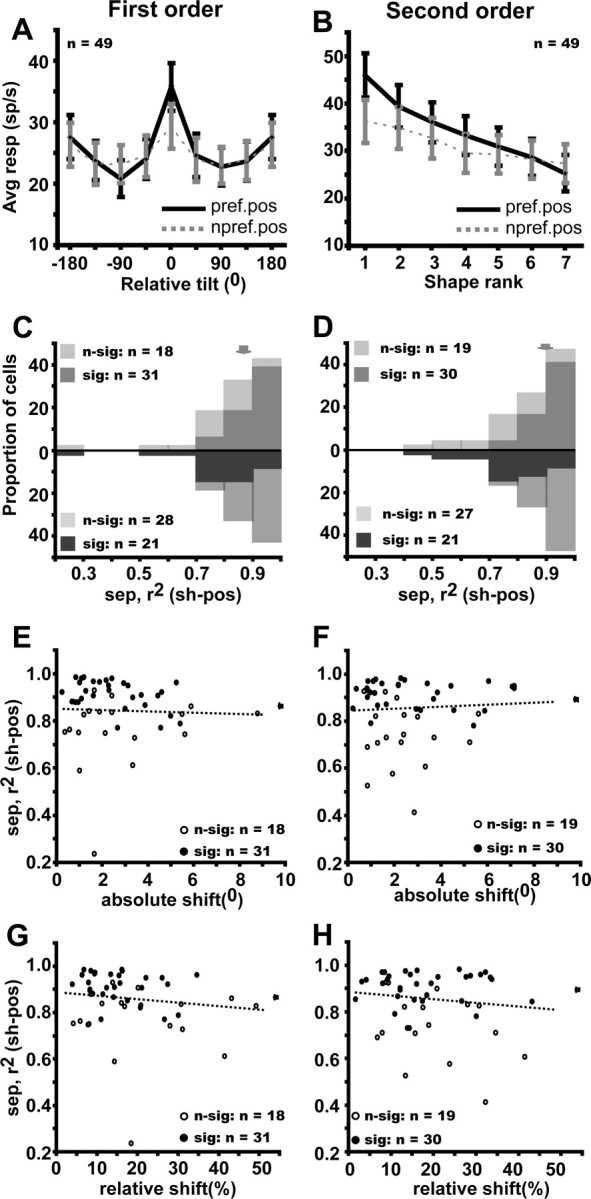
Position tolerance of FST neurons selective for first-order (A, C, E, G) and second-order (B, D, F, H) stimuli. A, B, Average gross response at preferred (black solid lines) and nonpreferred (gray dashed lines) position plotted as a function of relative tilt and rank in descending order of preference (both determined at preferred position). The tuning for nonpreferred position is significant: repeated-measures ANOVA, F(7,336) = 5.19, p < 10−3 and F(6,258) = 12.13, p < 10−7 for first and second order. C, D, Distribution of the (3D shape–position) separability index for first- and second-order selective neurons; light and dark hatching, respectively, indicate nonsignificant and significant neurons according to the permutation test (top row) and bootstrapping test (bottom row). Arrows indicate median values. E, F, Separability index plotted as a function of absolute shift: r2 = 0.002, NS and r2 = 0.003, NS, respectively. G, H, Separability index plotted as a function of relative shift (proportion of RF size): r2 = 0.04, NS and r2 = 0.03, NS, respectively.