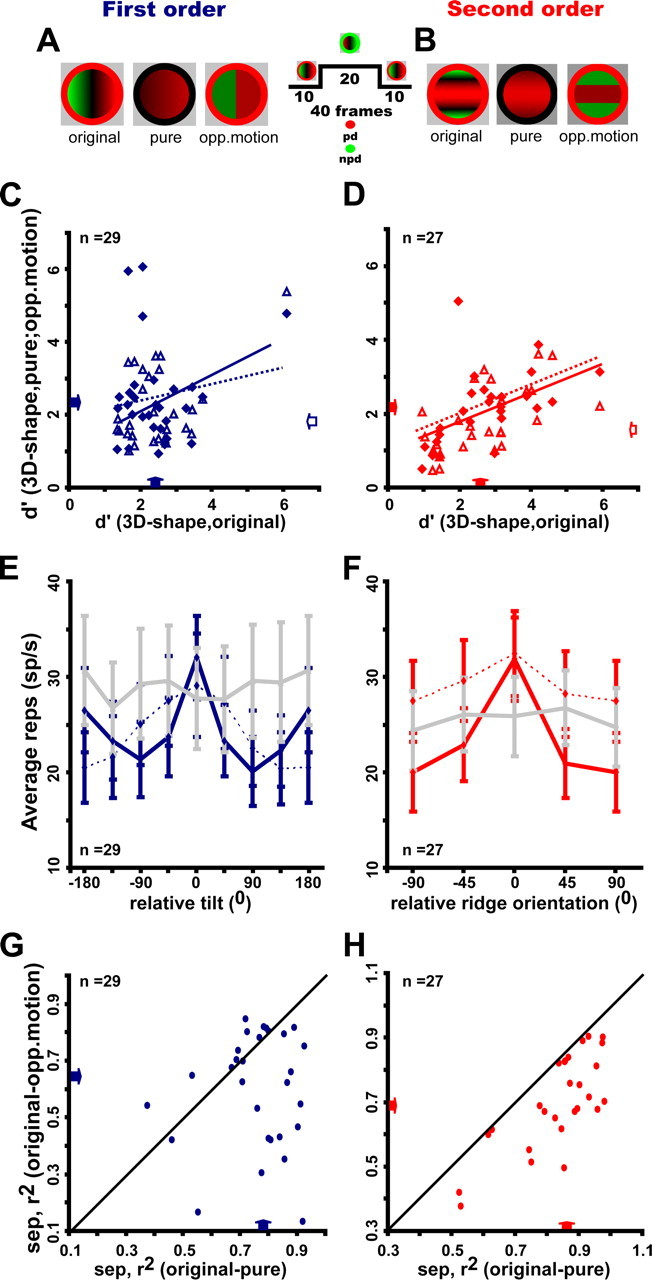
Figure 9.

Selectivity for single cue stimuli of FST neurons selective for first-order (A, C, E, G) and second-order (B, D, F, H) stimuli. A, B, Color plots of first-order (A) and ridge (B) stimuli: “original” are the original 3D-SFM stimuli, “pure gradients” include only a speed gradient, and “opponent-motion” stimuli contain only opposite directions of motion without speed gradients. C, D, d′ for 3D shape in the pure-gradient (filled symbols) and opponent-motion (open symbols) stimuli plotted as a function of d′ for 3D shape in the original stimuli; median values for first-order, original, 2.4 (1.7–2.71); pure-gradient, 2.2 (1.6–2.2); opponent-motion, 1.89 (1.5–3.0) [distribution differences, Wilcoxon's matched pair test, all NS: correlation original vs pure-gradient, r2 = 0.018, NS and original vs opponent-motion: r2 = 0.2, p < 0.02; median values for second order: original, 2.7 (1.5–3.2); pure-gradients, 2.15 (1.3–2.5); opponent-motion, 1.5 (1.1–2.5); distribution differences, Wilcoxon's matched pair test: original vs pure (Z = 3.1, p < 0.002), original vs opponent-motion (Z = 3.7, p < 0.0003); pure-gradients vs opponent-motion (Z = 2.07, ns), correlation original vs pure-gradient, r2 = 0.3 p < 0.004 and original vs opponent-motion, r2 = 0.36 p < 0.001]. E, F, Average gross response for original stimuli (dark solid lines) pure-gradient stimuli (dashed lines) and opponent-motion stimuli (light solid lines) plotted a function of relative tilt and rank in descending order of preference (both determined for the original stimuli). G, H, Separability index for the pair original–opponent-motion plotted as a function of separability index for the pair original–pure-gradients [median (quartiles) values for first order: 0.79 (0.71–0.86) for original–pure-gradient and 0.65 (0.43–0.78) for original–opponent-motion; distributions significantly different, Wilcoxon's matched pair test (Z = 2.78, p < 0.01); median values for second order: 0.86 (0.79–0.92) for original– pure-gradient and 0.69 (0.62–0.82) for original–opponent-motion; distributions significantly different on Wilcoxon's matched pair test (Z = 4.54, p < 0.2 10−5]. Arrows indicate median values.
