Fig. 1.

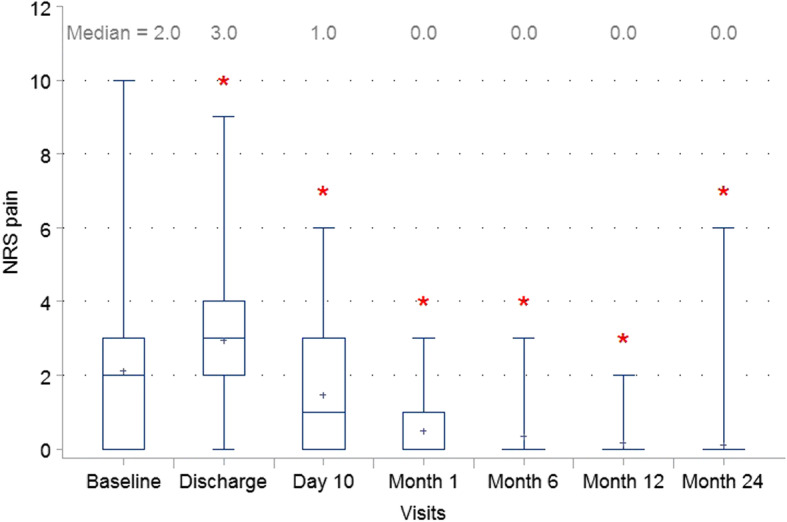
Numerical Rating Scale Pain Assessment. Patient pain levels by post-operative visit. Whiskers are drawn from quartiles (Q1 – Median – Q3 to the extreme values of the group) * indicates P < 0.05 relative to baseline

Numerical Rating Scale Pain Assessment. Patient pain levels by post-operative visit. Whiskers are drawn from quartiles (Q1 – Median – Q3 to the extreme values of the group) * indicates P < 0.05 relative to baseline