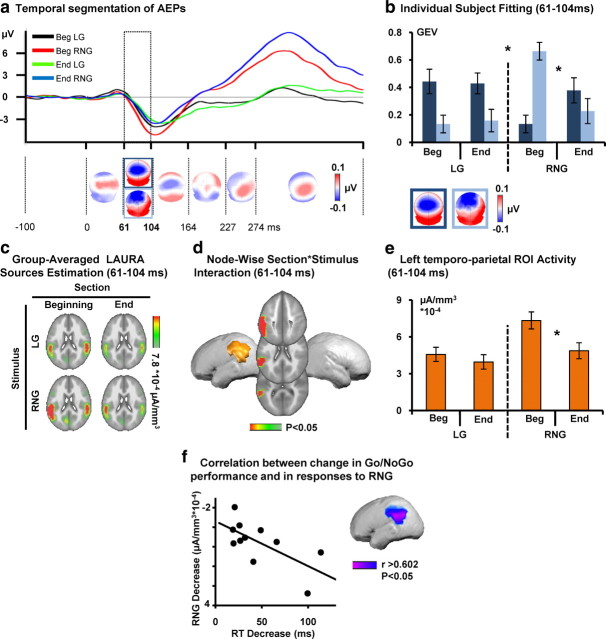
Figure 2.
Active Go/NoGo training: electrical neuroimaging results. a, The AEP in response to the beginning for Go (LG, black trace) and NoGo (RNG, red) and end for Go (green) and NoGo (blue) of the experiment are displayed in microvolts as a function of time for the Cz electrode. Topographic pattern analyses identified six time periods of stable electric field topography across the collective 452 ms poststimulus period. All topographies (i.e., maps) are shown with the nasion upward and left scalp leftward. For one of these time periods (61–104 ms), multiple maps were identified in the group-averaged AEPs. These maps are framed in blue. b, The reliability of this observation at the group-averaged level was then assessed at the single-subject level using a spatial correlation fitting procedure. The GEV of each template map provides a measure across subjects of how well a given template map accounts for a given condition over the 61–104 ms time period (see Materials and Methods). Over the 61–104 ms period after stimulus, different maps (framed in dark and light blue) described AEPs in response to the Go and NoGo stimuli as a function of training (beginning/end). There was a significant three-way interaction between section, stimulus, and map. Error bars indicate SEM. c, Group-averaged distributed linear source estimations were calculated over the 61–104 ms poststimulus period for each experimental condition (scale indicated), when AEPs analyses revealed a significant topographic modulation across conditions. d, Node-wise section × stimulus ANOVA on source estimation over the 61–104 ms interval revealed significant section × stimuli interactions within a left temporoparietal cluster. e, Follow-up analyses on the mean scalar value of the ROI revealed a decrease in the left temporoparietal cortex for the NoGo stimuli as a function of training. f, Node-wise correlations between response time to Go stimuli and the activity within the cluster showing the significant section × stimulus interaction revealed that the more performance improved, the more response strength to NoGo stimuli decreased within the left temporoparietal ROI.

