
Figure 3.
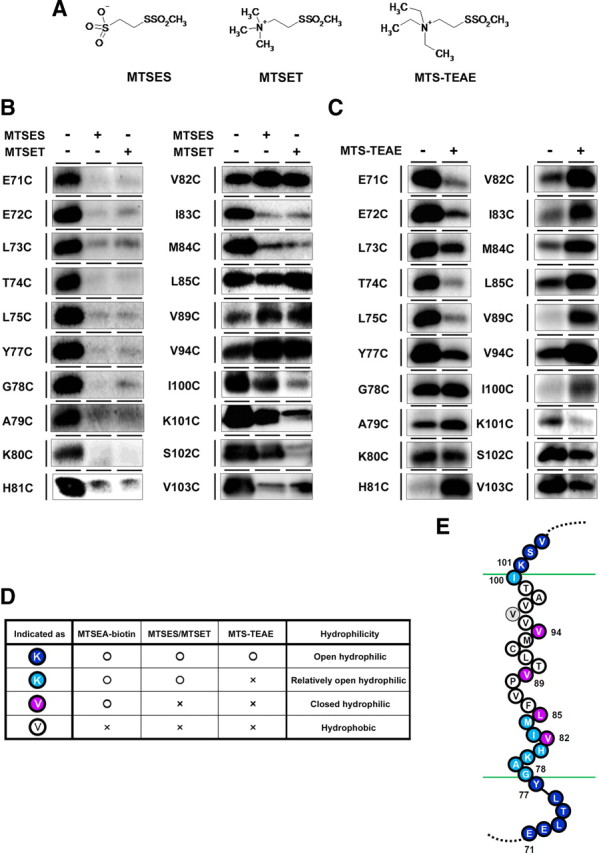
SCAM analysis of single-Cys mt PS1 using charged MTS reagents. A, The structures of the charged MTS reagents. The abbreviations are indicated below in B. B, Labeling competition of single-Cys mt PS1 around HR1 was examined after preincubation with negatively charged MTSES or positively charged MTSET. C, Labeling competition experiments using positively charged MTS-TEAE with a bulkier structure. D, Summary of the competition experiments using charged MTS reagents. E, Schematic depiction of TMD1. All charged reagents were accessible to the Cys-substituted residues indicated by blue circles. Residues whose labeling was competed by MTSES or MTSET, but not by MTS-TEAE, are indicated by sky-blue circles. Residues whose labeling was not decreased by any charged reagents are indicated by purple circles. Residues that were not labeled by MTSEA-biotin or unanalyzed are shown by black letters in white and gray circles, respectively. The predicted lipid–water interface is indicated by green lines.